Download
1 / 1
10 likes | 122 Views
Table 2. Seasonal dissolved oxygen (DO – mg/l) and oxidation reduction potential (ORP – mV) in the four wells. Hydrology and water quality of seepage slope wetlands on the SC Coastal Plain Daniel L. Tufford Department of Biological Sciences, University of South Carolina, Columbia, SC 29208.

E N D
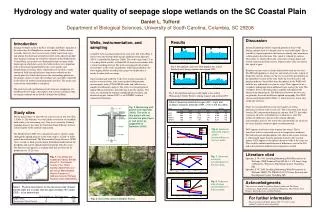
Table 2. Seasonal dissolved oxygen (DO – mg/l) and oxidation reduction potential (ORP – mV) in the four wells. Hydrology and water quality of seepage slope wetlands on the SC Coastal Plain Daniel L. TuffordDepartment of Biological Sciences, University of South Carolina, Columbia, SC 29208 Results Discussion Seasonal hydrology follows expected patterns in these wells. During summer there is a diurnal cycle in water table depth. This is caused by evapotranspiration that increases during early morning to a daily peak in the afternoon. This signal is reduced by autumn (November 3), which reflects the senescence of many plants and overall reduction in biotic activity. During winter (data not shown) this signal is gone. Response to rain events is clearly different between the two sites. The BF hydrograph has a steep rise and steady recession, typical of headwater streams. In this case the rise is caused by precipitation in the immediate vicinity of the well, while the recession curve and duration indicates lateral flow from the upland. At the WNP well both the rise and initial recession are steep. There appears to be a secondary hydrograph when additional water reaches the well. This secondary flow is substantial and is capable of displacing the timing of the diurnal peak. The differences between the two sites are probably the result of different upland topography. The WNP site has much higher bluffs (Table 1), which increases travel time within the soil layer. There are seasonal differences in water quality as well as differences between wells at each site. The water tends to be much lower in DO concentration during the summer (July 27) than other seasons in all wells, with differences within site as well. The within-site differences persist in the autumn although concentrations increase. By winter the concentrations are relatively the same. Similar comments apply to redox potential. DOC appears to decrease from summer into winter. This is consistent with less microbial activity as temperatures moderate. For both nitrogen and phosphorus (not shown) the organic fraction is substantially larger than the inorganic fraction. The seasonal pattern of TN appears to be different between wells at the same site. This could be another manifestation of differences seen in the DO and redox potential. Additional investigation is needed. Wells, instrumentation, and sampling A shallow well was placed adjacent to each seep. The wells (Figs. 2 and 3) were constructed following the guidelines from Sprecher (1993) as modified by Sprecher (2000). The wells range from 1.2 to 1.4 m deep. Each well has a Global WL15 water level recorder with a 1 hour recording interval. The wells were purged with a bailer several times in the weeks immediately following installation. An Onset tipping bucket recording rain gauge was deployed in a nearby location with no canopy. Once installed and stable the wells were visited seasonally to retrieve water level data, take water quality field parameter measurements with a YSI 600XLM sonde, and collect water samples for laboratory analysis. The wells were purged prior to taking YSI measurements and collecting water for analysis. The water was analyzed for nitrogen and phosphorus fractions and dissolved organic carbon (DOC) at an SCDHEC certified commercial laboratory. Introduction Seepage wetlands occur at the base of slopes and bluffs, typically at the outer edge of a floodplain or stream corridor. Unlike riverine wetlands, however, these receive most of their water from seeps and springs that discharge groundwater flow from adjacent upslope land. Seepage wetlands are relatively common on the Southeastern Coastal Plain; in fact they are a dominant feature on many of the landscapes in which they occur. It is believed they serve important roles in local and regional biodiversity, water quality, and biogeochemical cycling. These conclusions are based on a small amount of field data and inference from other wetlands on the coastal plain. It is likely that because the surrounding uplands are the primary source of water, these habitats are especially vulnerable to the effects of nearby land management activities. The nature and extent of the vulnerability is unknown. This poster provides preliminary results from one component of a broader project to begin a descriptive and systems ecological study of seepage wetlands on the South Carolina Coastal Plain. Fig 4. Precipitation and water table depth at one well in Beidler Forest during summer and autumn 2005. Fig 5. Precipitation and water table depth at one well in Wannamaker Nature Preserve during summer and autumn 2005. Fig. 2. Monitoring well profile from Sprecher (1993). The wells in this project did not include the grout layer or well point, as suggested in Sprecher (2000). Study sites For the initial study we selected two seeps at each of two sites (Fig. 1; Table 1). The objective was to facilitate assessment of variability both within a site and among sites. One site is owned by National Audubon Society; the other by Charleston Natural History Society, a local chapter of the national organization. The Beidler Forest (BF) site is old-growth cypress-tupelo swamp, although the upland adjacent to the study seeps is second- or third-growth mixed hardwood. The Wannamaker Nature Preserve (WNP) site is second- or third-growth mature bottomland hardwood on the floodplain and mature upland hardwood upslope from the seeps. The Preserve encompasses a working farm that has been out of production for 15-20 years. Fig. 6. Seasonal dissolved organic carbon concentrations in the four wells. Literature cited Sprecher, S. W. 1993. Installing Monitoring Wells/Piezometers in Wetlands. WRP Technical Note HY-IA-3.1, US Army Corps of Engineers, Waterways Experiment Station, Vicksburg, MS. Sprecher, S. W. 2000. Installing Monitoring Wells/Piezometers in Wetlands. ERDC TN-WRAP-00-02, US Army Research and Development Center, Vicksburg, MS. Fig. 7. Seasonal ammonia concentrations in the four wells. Fig. 1. Two seeps are located at Francis Beidler Forest (1, Dorchester County, Four Holes Swamp watershed) and two are at Wannamaker Nature Preserve (2, Calhoun County, Halfway Swamp Creek watershed). Acknowledgments This work was funded by Audubon South Carolina and The Nature Conservancy. Special thanks go to Norman Brunswig, John Nelson, Steve Bennett, Kristin Harrison, and Dick Watkins. Fig. 8. Seasonal total nitrogen concentrations in the four wells. Table 1. Physical descriptions for the two study sites. At each site the wells are in seeps that are approximately 75 m apart. (TBD – to be determined) For further information Please contact Dan Tufford (phone: 803-777-3292; e-mail: tufford@sc.edu) for more information. Fig. 3. One of the wells in Beidler Forest.


