Download
1 / 42
430 likes | 668 Views
Lecture 17 03/29/05. Functional biology of and limitations to Photosynthesis. Last Time. Biomechanics and allometry. Biomechanics. Euler buckling equation. How the Euler equation has constrained and guided plant evolution. Different ways to be a tree. Allometry.

E N D
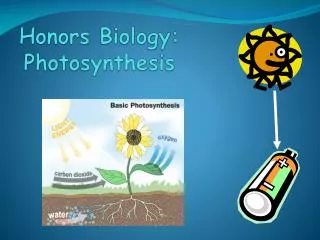
Lecture 17 03/29/05 Functional biology of and limitations to Photosynthesis
Last Time Biomechanics and allometry Biomechanics Euler buckling equation How the Euler equation has constrained and guided plant evolution Different ways to be a tree Allometry Allometric growth and biomass partitioning
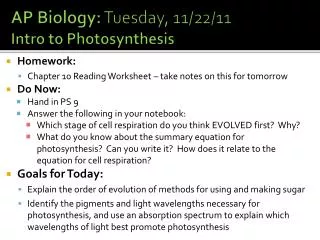
Today Photosynthesis Part II -Carbon reactions -Light reactions review -What regulates photosynthesis (carbon reactions) -Controls over CO2 diffusion -Carbon fixation limits -Biochemical control over carbon fixation -Triose-P transporter -A/Ci Curves
Central Question • What have been the important constraints which have shaped the evolution of plant form and function? • Last Lecture (2nd lecture in class) • Evolution of Photoautotrophy • Basic form of the photosynthetic apparatus • This Lecture • Controls over photosynthesis - evolutionary implications / important variation
www.tiscali.co.uk/.../ hutchinson/m0030839.html users.rcn.com/.../ BiologyPages/L/Leaf.html
Palisade cells are packed with chlorophyll and mitochondria A group of palisade mesophyll cells in a spinach leaf, in confocal stereo. The numerous mitochondria (light green) lie between the chloroplasts (light green) (which are only very dimly fluorescent under the optical conditions used here). Some are round particles, others long branched filaments. Some are slightly blurred because the cells were still alive and the mitochondria were moving while the image was being recorded. Chloroplasts are light green and essentially fill most of the cell. Fluorescently vital stained with Rhodamine-123.
Where do these reactions take place?? www.kensbiorefs.com/ cellstructure.html http://www.daviddarling.info/images/chloroplast.jpg
3 Major Functions of Light Reactions Harvest Light Membrane
Where does the ATP and NADPH go from the light reactions? The Calvin cycle (PCR cycle) Turns out there is plenty of light energy, most of the time, what regulates photosynthesis is carboxylation! Calvin Cycle or Photosynthetic Carbon Reduction (PCR Cycle)
Overview - Photosynthetic Apparatus • Light harvesting reactions • Resources: Light (photons) and Water (electrons) • Products: ATP (energy), H+ (potential energy) and NADPH (reducing power) • Carbon reactions
Carbon fixation reactions (C3 Photosynthesis) Use ATP and NADPH from light harvesting reactions to reduce CO2 to sugars
Initial product is A 3 carbon sugar (PGA) Phosphoglyceric acid Carbon fixation catalyzed by enzyme Ribulose-bisphosphate carboxylase-oxygenase Rubisco Chloroplast inner membranes Chloroplast
http://www.biologie.uni-hamburg.de/b-online/fo24_1/e1rxoe.htmhttp://www.biologie.uni-hamburg.de/b-online/fo24_1/e1rxoe.htm Structure of Rubisco showing its four-fold symmetry. From the University of Hamburg site.
Rate of Rubisco mediated PCR cycle is mediated by Light concentration Starch is a chain of sugars
All reactions are enzyme mediated Catalyst Substrates Products [enzyme] [A] + [B] C + D Rate of production of A* will depend upon many things -Most importantly on concentrations of players -Efficiency of enzyme If [enzyme] is low then reaction is enzyme (binding site) limited If [A] and or [B] is low then reaction is substrate limited
Notable Features of Carbon Fixation Reactions (i)Large nitrogen requirement for Rubisco and other photosynthetic enzymes (Nitrogen limitation) (ii)Dependence on the products of the light-harvesting reactions (which depends on amount of light hitting leaf) (iii)Dependent upon CO2 supply to the chloroplast What influences CO2 supply? Ability of CO2 to reach reactions. . .
Limits to Photosynthesis Consider one important limit - diffusion of CO2 into chloroplasts from atmosphere How can we make sense of CO2 limitation of photosynthesis?
Fick’s Law of Diffusion In order to exchange ‘resources’ with the environment plants must follow diffusion laws Diffusion coefficient (varies with temp and concentration) Flow of certain resource per unit area per unit time Concentration Gradient (change in resource concentration, cj with distance, x)
Resistance Pathway Plants regulate CO2 uptake and water loss by changing the size of stomatal opening (which regulates Stomatal conductance - the flux of water vapor or CO2 per unit driving force (a given concentration gradient)
Elaborating Fick’s Law - Anatomy of the System Conversion – Fick’s Law JCO2 = Dx / r JCO2 is the flux of CO2 Dx is the concentration gradient r is the sum of all resistances to the flux of CO2 along that path • (since we identify CO2, we remove the diffusivity term • – but it will return when we begin to consider water versus CO2)
Elaborating Fick’s Law - Concentration gradient • Ca is the external CO2 concentration (external to the leaf) • Ciis the concentration at the site of carboxylation (we call this “intercellular CO2 concentration)
Resistance Pathway Resistances to CO2 diffusion • Boundary layer air-phase resistance • Stomatal resistance (=1/conductance) • Internal air spaces aqueous-phase resistance • Diffusional resistance across mesophyll cell wall • Resistance at the site of carboxylation (chloroplast resistance Should a plant always minimize resistance to CO2 diffusion?
Remember . . . . When plants reduce stomatal conductance (or Increase resistance) water is conserved BUT photosynthesis declines. Also, when water stress is too great stomates will close Reduce the efficiency with which plants converts light energy to carbohydrates
Notable Features of Carbon Fixation Reactions (i) Large nitrogen requirement for rubisco and other photosynthetic enzymes (Nitrogen limitation) (ii) Dependence on the products of the light-harvesting reactions (which depends on amount of light hitting leaf) (iii) CO2 supply to the chloroplast • (iv) Phosphate Translocator – mediates the ‘supply’ • and ‘demand’ for triose-P in the cell • “Source-Sink” theory and carbohydrate backup
Summary - Biochemical regulation of photosynthesis • Light Reactions – mediate inputs of energy • Rubisco (Ribulose bisphosphate carboxylase / oxygenase) – mediates inputs of carbon • Extensive research has shown that Rubsico controls the reaction rates of the whole Calvin cycle reaction complex • Phosphate Translocator – mediates the ‘supply’ and ‘demand’ for triose-P in the cell • “Source-Sink” theory and carbohydrate backup
Triose Phosphate/ Inorganic Phosphate Translocator (TPT) Production of sucrose Chloroplast
Transporters - exchange between Chloroplast and Cytosol Outer membrane of chloroplast has pore-forming proteins (porins) - allow substances to diffuse freely Inner chloroplast membrane is the permeability barrier - transport is usually by specific translocators Rate of transport depends upon demand for Sucrose
Take-home from the Pi regulation • The translocator is ultimately controlled by sink strength of the plant (the ability of plant’s sinks to utilize sucrose) • If sucrose builds up in the leaf due to lack of sink strength, it negatively feeds back on reactions in the cytosol (which in turn slows down the generation of Pi) • Pi must be available to exchange with triose-P out of the chloroplast. • Lack of triose-P transport results in triose-P converted into starch in the chloroplasts. • (slows RuBP regeneration)
Sharkey Table – limitations of photosynthesis • Rubisco activity limits photosynthesis under high light, low Ci conditions, so there is more RuBP (ribulose 1,5 bisphosphate) than binding sites on Rubisco. • RuBP regeneration limits photosynthesis under low light and high CO2, so there are open binding sites on Rubisco because electron transport capacity is inadequate to regenerate enough RuBP • Triose-P utilization limits photosynthesis under high light and high CO2, also resulting in more RuBP than available Rubisco binding sites.
How do we make sense of the Limits to Photosynthesis? The A/Ci Curve A = CO2 Assimilation Rate Ci = Internal [CO2]
Assimilation rate (mmol m-2 s-1) Internal CO2 concentration (mmol mol-1)
Ca Demand Function Assimilation rate (mmol m-2 s-1) RuBP saturated region Internal CO2 concentration (mmol mol-1)
What sets this intercept? *key feature that has driven evolutionary diversification in land plants!
Ca Demand Function Assimilation rate (mmol m-2 s-1) RuBP saturated region Internal CO2 concentration (mmol mol-1)
Ca ? Demand Function Assimilation rate (mmol m-2 s-1) RuBP saturated region Internal CO2 concentration (mmol mol-1)
Ca Demand Function Assimilation rate (mmol m-2 s-1) RuBP saturated region Internal CO2 concentration (mmol mol-1)
Plant Example #1 Ca Rates of RuBP regeneration limiting to photosynthesis Ci Demand Function Assimilation rate (mmol m-2 s-1) RuBP saturated region Supply Function Internal CO2 concentration (mmol mol-1) Supply function Rate at which CO2 is supplied to rubisco sites and is determined by [CO2] in atmosphere and Stomatal conductance (1/resistance)
Plant Example #2 Demand Function Ci Assimilation rate (mmol m-2 s-1) Supply Function Ca Internal CO2 concentration (mmol mol-1) How does plant #2 differ from plant #1?
Controls over photosynthesis What Controls Demand and Supply Functions? Supply function – controlled by stomatal responses to:
Controls over photosynthesis Demand function – controlled by: