Download
1 / 64
650 likes | 1.52k Views
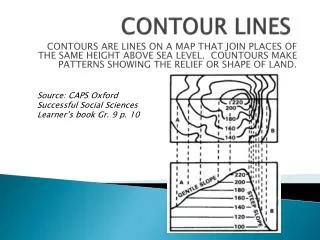
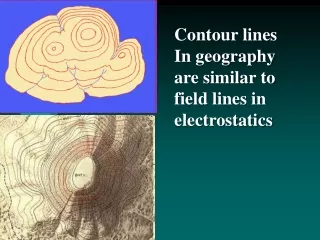
Contour Lines. Definition. A contour line is a line that passes through points having the same elevation.*. *Surveying, 10ed, Moffit & Bossler. Elevation from Contours. Elevations of points between contours can be determined by interpolation. Slope from Contours.

E N D
Definition A contour line is a line that passes through points having the same elevation.* *Surveying, 10ed, Moffit & Bossler
Elevation from Contours Elevations of points between contours can be determined by interpolation.
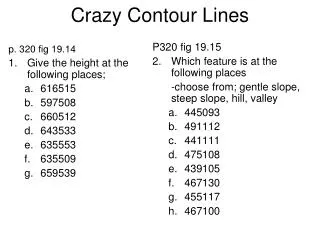
Slope from Contours Determine the slope between the two points on the map. The percent slope can also be determined from the contour lines on a topo map. Rise = 200 - 150 = 50 ft Run = 2.625 in x 1,000 ft/in
Eleven (11) characteristics of contour lines • Contour lines are continuous. • Contour lines are relatively parallel unless one of two conditions exists. • A series of V-shape indicates a valley and the V’s point to higher elevation. • A series U shape indicates a ridge. The U shapes will point to lower elevation. • Evenly spaced lines indicate an area of uniform slope.
Contour Line Characteristics-cont. • A series of closed contours with increasing elevation indicates a hill and a series of closed contours with decreasing elevation indicates a depression. • Closed contours may be identified with a +, hill, or -, depression. • Closed contours may include hachure marks. Hachures are short lines perpendicular to the contour line. They point to lower elevation.
Contour Line Characteristics-cont. • The distance between contour lines indicates the steepness of the slope. The greater the distance between two contours the less the slope. The opposite is also true. • Contours are perpendicular to the maximum slope. • A different type of line should be used for contours of major elevations. For example at 100, 50 and 10 foot intervals. Common practice is to identify the major elevations lines, or every fifth line, with a bolder, wider, line.
1. Contours are Continuous • Some contour lines may close within the map, but others will not. • In this case, they will start at a boundary line and end at a boundary line. • Contours must either close or extend from boundary to boundary.
1. Continuous Contours-cont. Is the topo map correct? • No • Contour 1040 is very unlikely • This would only occur if there were a long vertical wall.
2. Contour lines are parallel • Two exceptions: • They will meet at a vertical cliff • They will overlap at a cave or overhang. 3. When contour lines overlap, the lower elevation contour should be dashed for the duration of the overlap.
3. Valleys and higher elevation A series of V-shapes indicates a valley and the V’s point to higher elevation.
4. U shapes and ridge A series of U shapes indicates a ridge. The U shapes will point to lower elevation.
5. Contour Spacing Evenly spaced contours indicate an area of uniform slope. Unevenly spaced contours indicates an area with variable slope.
6. Hills and Depressions A series of closed contours with increasing elevation indicates a hill. Hills may be identified with a “+” with the elevations
6. Hills and Depressions--cont. • A series of closed contours with decreasing elevation indicates a depression. • Depressions may be identified with a “-”.
8. Hachures • Hachures are short lines which are perpendicular to the contour line. • Used to indicate a hill or a depression. • Not used on modern maps.
9. Contour Spacing • Contours spaced close together indicate a higher % slope. • Contours spaced wider apart indicate lower % slope.
9. Contour Spacing--cont. Contours are perpendicular to maximum slope. • Different types of lines should be used for contours of major elevations. • Common practice is to identify the major elevations lines, or every fifth line, with a bolder, wider, line.
Another decision that must be made is the contour interval. • The “best” interval depends on the use of the data. 9. Contour Spacing-Intervals
Two Issues On Data Collection When collecting topo data there are two important issues: • Ensuring sufficient data is collected to define the object. • Ensuring two types of information is gathered for each station: • Location • Elevation
Defining an Object • It is important to remember that topographic surveys are three dimensional. • To accurately represent an object on a topo map data must be collected to define the shape, location and changes in elevation for an object.
Defining An Object-Hills and Depressions How many stations are required to define the shape of a hill or depression? 17 ? 20 ?
Defining An Object-Ditches Another situations that requires some thought is how many stations are required to define the cross section of a ditch and length of a ditch. Trapezoidal cross section = minimum of 6 Entire ditch = ?? 19
Interpolation • Drawing contour lines to produce a topographic map requires the ability to interpolated between points. • Interpolation is required because contour lines are lines of constant elevation and the station elevations that are measured in the field seldom fall on the desired contour elevation. • Interpolating is finding the proportional distance from the grid points to the contour line elevation.
Interpolation • Interpolating can be done by estimation for low precision maps. • It should be done by calculation and measurement for higher precision maps. • A combination of methods can also be used, depending on the use of the map.
Interpolating by Estimation • Study the illustration. • Logic or intuitive reasoning would conclude that when the grid points are at 102 feet elevation and 98 feet elevation, then a contour line of 100 feet elevation would be half way in between. Note: that a dashed line has been drawn between the two points. In topographic surveying it is assumed that the area between two measured stations is a plane.
Interpolating by Calculation • Proportional distance is calculated using an equation. • For the previous example this would result in: • The 100 foot contour line would be located 0.5 or half of the distance between the two stations.
Interpolation by Calculation & Estimation • The same equation is used for all grid distances and all contour lines. • Example: Determine the location of the 96 foot contour line for the illustration.
Interpolation by Calculation and Measurement • Start by selecting an contour interval and two grid points. • This example starts with the 110 foot interval. • The first step is to calculate the position of the 110 foot contour between stations A1 and A2.
Interpolation by Calculation and measurement--cont. The next step is to measure and mark the position of 0.6. Next, determine which direction the contour goes between the diagonal and the other three sides of the grid. Mark the next points.
Interpolation by Calculation and measurement--cont. The 110 foot contour line passes between B1 and B2, therefore the next station is the diagonal. These steps are followed one grid line at a time until the contour closes, or reaches the edge of the map.
Interpolation by Calculation and measurement--cont. Determining the proportion for line B1:B2.
Interpolation by Calculation and measurement--cont. The grid lines and diagonals for each square are considered and the contour is extended.
Interpolation by Calculation and measurement--cont. The next grid line is between B2 and C2.
Interpolation by Calculation and measurement--cont. Each grid line and diagonal is considered and the contour line is extend between the appropriate points.
Interpolation by Calculation and measurement--cont. • When the contour points form a closed shape or have extended from one edge of the map to another, a smooth line is drawn connecting the points. • The contour lines must be labeled.
Drawing Contour Lines • Topographic maps are three dimensional. • When drawing contour lines all possible paths must be investigated. • A simple grid will be used to demonstrate this point.
Drawing Contour Lines-cont. There is no right or wrong starting point. Pick a contour interval, start at one edge and extend the contour across the map. This example starts with the 14 foot contour. In this example even numbered contours will be used.
Grid Example--cont. • A3 is at 13 ft elevation and A4 is at 15 ft elevation, a 14 ft contour would be half way in between. • The next step is to determine which diagonal and which grid line it passes through. • A3 and B3 are both at 13 ft, therefore the 14 foot contour does not pass between them. • B4 is at 14 ft, therefore the 14 ft contour interval would pass through station B4. • Before marking station B4 the diagonals must be checked.
Grid Example--cont. • The diagonals must be checked to determine if the 14 ft contour continues to station B4. • B3 is at 13 ft, A4 is at 15 ft, a 14 ft elevation is present between these two points, therefore the contour line can be extended to station B4. • Each pair of grid points are investigated and the contour is extended until it is complete.
Grid Example--cont. • To extend the contour the next options must be checked. • Station B3 is at 13 feet elevation and station B4 is at 14 feet elevation. • The contour extends from the diagonal position to station B4.
Grid Example--Drawing Contour Lines This contour is completed by connecting the points with a smooth line.
Grid Example--cont. • The 12 foot interval is completed in the same way. • A2 is at 11 ft and A3 is at 13 ft, therefore the 12 foot contour is half way between A2 and A3. • A2 and B2 are both at 11 ft, the contour doesn’t go between these two. • A3 is 13 ft and B3 is 13 ft, it doesn’t go this way. • B2 is 11 ft and B3 is 13 ft, a 12 ft elevation is half way between. This 12 ft interval will pass through this point, as long as the diagonals are ok.
Grid Example-cont. • The next grid is more difficult because a 12 foot contour line will pass through both B2:C2 and B3:C3. • In addition to go either way would violate the diagonals. • The remaining points must be investigated to determine the best path.
Grid Example--cont. • If the contour is extended through B2:C2 and completed to D3, the diagonal must also be violated at D2:C3 to continue on to D3. • There should be a better interpretation.
Grid Example--cont. • The contour should be completed by passing between B3:C3. • This a better interpretation because: • the contour is completed without violating the diagonal at C3:D4. • The 12 foot contour parallels the 14 foot contour.
Grid Example--cont. • The 10 foot interval is completed in the same way. • At this point there is a danger of considering the map complete, but you must always check for a possible hill or depression on the map. • In this example there is 12 foot contour around C2.