Download
1 / 43
460 likes | 640 Views
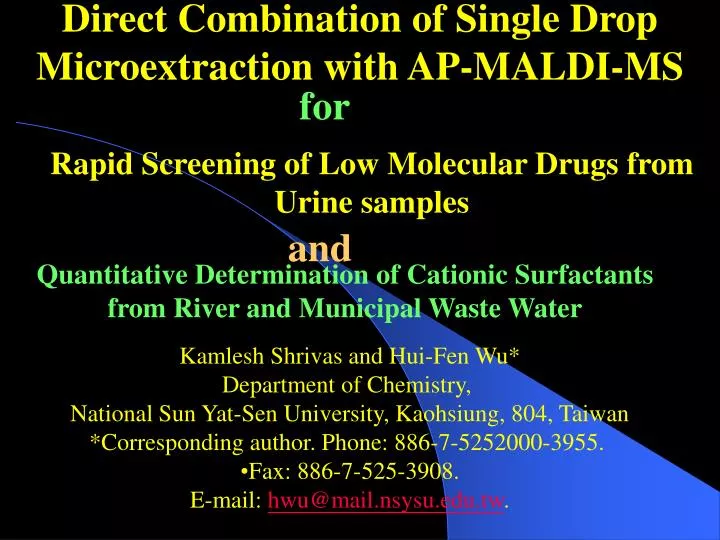
Direct Combination of Single Drop Microextraction with AP-MALDI-MS. for. Rapid Screening of Low Molecular Drugs from Urine samples. and. Quantitative Determination of Cationic Surfactants from River and Municipal Waste Water. 466.7. Kamlesh Shrivas and Hui-Fen Wu* Department of Chemistry,

E N D
Direct Combination of Single Drop Microextraction with AP-MALDI-MS for Rapid Screening of Low Molecular Drugs from Urine samples and Quantitative Determination of Cationic Surfactants from River and Municipal Waste Water 466.7 • Kamlesh Shrivas and Hui-Fen Wu* • Department of Chemistry, • National Sun Yat-Sen University, Kaohsiung, 804, Taiwan • *Corresponding author. Phone: 886-7-5252000-3955. • Fax: 886-7-525-3908. • E-mail: hwu@mail.nsysu.edu.tw. 368.5 284.5 304.3
Rapid Screening of Low Molecular Drugs from Urine samples • Present work reports the development of a new analytical procedure for simple and rapid screening of low molecular weight drugs (<500 Da.) from human urine sample by atmospheric pressure-matrix assisted laser desorption/ionization mass spectrometry (AP-MALDI/MS) combined with single drop micro extraction (SDME). • The success of the proposed work was due to use of methyltrioctyl ammonium bromide (MTOAC) as additives to avoid signal to noise ratio of the matrix ions • Also, SDME aided in the separation and enrichment of analytes from urine sample prior to AP-MALDI/MS analysis. This results in obtaining clean spectra and gain good sensitivity of the method
The RSD and LOD of the method in urine sample were 8.2-14% and 0.3-1.6 μM respectively • SDME was compared with liquid-liquid extraction (LLE) and hollow fiber-liquid phase microextraction technique to know compatibility of the present method in the extraction of drugs from urine sample. • Thus, MTOAC as matrix ion signal suppressor and SDME as analyte separating devise in the AP-MALDI/MS analysis are shown to provide valuable information with simple, low cost and rapid screening of low molecular weight drugs from human urine sample.
Matrix assisted laser desorption/ionisation mass spectrometry (MALDI/MS) is widely applied in the field of protein, oligosachharides, polymers and drug analysis. For higher molecular analysis of organic compounds by MALDI/MS is very successful may be due signal to noise ratio was negligible. • However, analysis of low molecular compounds (<500 Da) is still challenge for analytical chemist, because matrix noise signals usually complicate in interpenetration of sample signals in the lower molecular range • The matrix organic compounds in use have low molecular < 300 Da, due to this, they act as their own matrix during laser radiation and producing many matrix ions in mass spectra.
In the present study, the background signal caused by the CHCA ions and matrices present in the sample was alleviated by the simultaneous use of two approaches. • MTOAC as additive to reduce the matrix ion signal is the first and SDME was combined to separate and preconcentrate the drugs from human urine earlier to AP-MALDI/MS analysis being the second. • The limit of detection and precision of the method in urine sample was investigated for the validity of the proposed method.
INSTRUMENT: The analyses of all drugs were carried on Finnigan LCQ ion trap mass spectrometer (Thermoquest Inc., San Jose, CA, USA) equipped with an AP-MALDI/MS source. Mass spectra were obtained in the positive ion mode with laser power attenuated at 60% at 10 Hz. Other operating conditions: capillary temperature 250 oC, capillary voltage 40 V, tube lens offset 70 V and ion injection time 1070 ms, respectively. The mass spectrometer was equipped with nitrogen laser of 337 nm. All spectra were scanning for 1 min in the mass range of 100-500 Da.
AP-MALDI/MS analysis of drugs assisted with SDME • CHCA is widely used as matrix in the MALDI-MS analysis for peptides and drug due to its homogenous crystal formation with analytes. Also, it is good absorber and transfer of laser energy to analytes through ionization process • But actual problem was associated during of analysis of lower mass organic compounds (<500 Da.). Figure 1 shows AP-MALDI-MS spectra of all drugs, nortriptyline (NT), amitriptyline (AT), imipramine (IP), trimeprazine (TM) and quinine (QN) at m/z 264.5 (NT+H+), 278.1 (AT+H+), 281.2 (IP+H+), and 325.4 (QN+H+), prior to SDME at CHCA concentration of 0.028 M (without MTOAC).
AT+H+ 278.1 Abundance QN+H+ NT+H+ 325.4 IP+H+ 264.5 2 CHCA-CO2+H+ 2 CHCA+H+ TM 378.9 281.3 CHCA-H2O+H+ CHCA+H+ 298.2 335.4 190.4 172.5. m/z Figure 1. AP-MALDI/MS spectra of spiked drugs (11 μM) from deionized water using SDME at CHCA concentration of 0.026 M.
Figure 1, also represents the AP-MALDI/MS spectra of matrix ions observed at m/z 172.5 (CHCA-H2O+H+), 190.4 (CHCA+H+), 335.4 (2CHCA-CO2+H+) and 378.9 (2CHCA+H)+. • These are the prominent peaks, which could create confusion in the identification of analyts in the low-mass range analysis. These spectra show the domination of the matrix signal over analyte signals. • In order to suppress the signals of matrix ions and to obtain clean spectra of the drugs of interest, MTOAC was added • Figures 2 (a) to 2 (c) show the AP-MALDI/MS spectra of drugs after applying different molar concentration ratio of CHCA/ MTOAC from 10000:1 to 700:1, prior to separation of drugs by the SDME.
368.5 700000 350000 379.1 278.1 281.1 325.5 298.1 264.3 172.1 190.3 100000 300 500 150 m/z Abundance 368.5 120000 600000 278.1 379.1 281.1 325.5 264.3 298.1 172.1 190.3 100000 300 500 150 m/z 368.5 120000 600000 278.1 281.1 325.5 264.3 298.1 100000 500 150 300 m/z
Figure 2 (a) displays the intense peak of surfactant produced at m/z 368.5 (MTAO+) by losing Cl- ion from MTOAC. • It was observed that the proper fixing of CHCA/MTOAC concentration ratio in AP-MALDI/MS analysis of drugs before to SDME was very significant. • The use of higher concentration of MTOAC may cause suppression of drug signal peak (not shown) and lower concentration could cause more signal to noise ratio by the matrix (CHCA) as shown in figure 2 (a) and 2 (b). • The optimum ratio of CHCA/MTOAC for obtaining clean spectra for the determination of drugs prior to SDME was 700:1, shown in figure 2 (c). Hence, this optimum ratio of CHCA/MTOAC was used for further investigations.
Optimization of Single Drop Microextraction Extraction efficiency of each drug was observed by the abundance of signal of three replicate analyses. The results obtained for optimization of extraction parameters are given in table 1. Optimum extraction efficiency of drugs were obtained at the following conditions: xylene as extracting solvent, stirring speed 240 rpm, extraction time 10 min, exposure volume of acceptor phase 1.0 μL and salt addition of 10 % at room temperature.
Table 1. Effect of solvent, stirring speed, extraction time, exposure volume of acceptor phase and salt on the extraction efficiency of drugs in water by SDME/AP-MALDI/MS. Extraction parameters Nortriptyline Amitriptyline Imipramine Trimeprazine Quinine Abundance RSD, % Abundance RSD, % Abundance RSD, % Abundance RSD, % Abundance RSD, % Effect of solvent Xylene 60123 10.6 160386 12.6 53536 5.4 29632 11.0 84371 9.6 Toluene 26782 7.2 138690 9.7 38207 8.5 11136 12.0 23456 6.0 Octane 2221 8.0 11136 11.4 32207 7.1 3999 9.6 6924 8.7 Chloroform 4788 6.8 7803 7.0 2952 11.5 1668 10.0 17971 4.7 Octanol 2618 7.6 2736 9.3 3467 7.4 1673 10.4 4045 6.6 Stirring speed, rpm 0 43475 6.0 1187 8.1 1906 10.0 9011 11.3 85368 7.5 120 55799 4.2 216210 9.2 24916 7.5 30908 11.0 90123 12.5 240 62417 8.5 282727 8.6 57045 9.0 34927 9.0 94283 8.4 360 49418 12.2 209749 11.5 40522 13.4 33424 8.6 57136 13.0 Extraction time, min 2 18948 9.0 70144 10.3 9492 11.5 2994 12.4 26658 12.6 5 22556 6.1 263946 9.8 22857 9.2 27160 6.8 31683 11.2 7 26943 7.0 276826 10.7 41831 5.8 35812 5.6 49923 5.8 10 64257 6.7 296223 7.2 56977 10.3 40189 9.4 95643 8.3 12 27969 12.4 281734 10.5 39203 8.9 40842 5.6 39301 7.4 Exposed volume of acceptor phase, μL 0.4 16334 12.6 137961 11.0 18916 11.7 15504 8.6 15766 10.5 0.6 19227 8.9 156879 9.8 21215 7.3 23453 9.5 26776 5.6 0.8 34213 10.5 354213 7.8 30987 9.6 34521 8.1 87543 9.5 1.0 66881 8.3 409861 10.3 59543 7.5 42134 7.3 101875 11.4 1.2 44123 12.8 389743 10.3 50845 9.0 35478 7.9 50974 8.1 Effect of salt, % 5 70543 7.8 432164 9.5 70432 10.5 45321 9.9 132532 12.1 10 72543 10.3 473246 11.0 75734 6.8 50534 10.4 152357 8.8 15 30876 5.8 354243 6.4 42154 8.9 24357 8.5 87597 4.9 20 25643 11.3 211544 9.8 27654 12.1 20991 8.4 70764 10.3
APPLICATION • The precision of the proposed method was checked by replicate analysis (n=6) of 3.5 μM of drugs in urine sample at the optimized condition of SDME. The RSD of the method was < 12%. The LOD values obtained for drugs in urine were found from 0.3-1.6 and 11-18 μM with and without use of MTOAC respectively are given in table 2. 10-43 folds of improvements of LOD were obtained when the MTOAC was used as additive to suppress the peaks of matrices ions. • This results showing that SDME can also useful excluding interference caused by the matrices in the urine samples. Also, 13-52 folds enrichment factors were calculated at concentration of 1.6 μM were spiked in the urine samples
Table 2. Determination of LOD and enrichment factor for drugs (μM) in urine sample by SDME/AP-MALDI/MS with and without MTOAC Drugs With MTOAC Without MTOAC Drugs LOD RSD, % (n=3) EF RSD, % (n=3) LOD RSD, % (n=3) EF RSD, % (n=3) Nortriptyline 0.75 11.4 18 9.8 15.1 10.5 7 11.0 Amitriptyline 0.30 10.0 52 10.4 11.0 8.8 19 10.5 Imipramine 1.60 8.0 13 8.8 18.3 10.8 7 8.6 Trimeprazine 1.60 8.3 21 11.0 16.2 9.7 5 9.6 Quinine 0.30 7.8 40 8.5 13.3 11.2 12 10.4
Comparision of microextraction techniques: • The LOD values for the SDME, HF-LPME and LLE were 0.3-1.6, 0.3-2.3 and 11-23 μM, respectively. • Compared to the customary LLE method, the current SDME offers better sensitivity. • The limit of detection acquired by the present method was as good as the HF-LPME. • However, SDME was recognized as simple and faster than HF-LPME may be due to the direct suspending of organic solvent in the tip of syringe for extraction of analytes from aqueous phase, instead of placing solvent in to hollow fiber (extra steps were involved cleaning of hollow fiber before placing solvent).
CONCLUSION: • This method is proved to be simple and rapid method for screening of low molecular drugs from urine sample. • The background signal to noise ratio is very negligible when MTOAC used as additives. • Separation and preconcentration excludes most of the interference during the analysis of drugs from urine sample by SDME. Both the approach helped in reducing matrix interferences. • This method could act as model for monitoring low molecular drugs in biological samples, urine and plasma.
Quantitative Determination of Cationic Surfactants from River and Municipal Waste Water
Summary of the proposed work • Method was based on the extraction of CS+ from aqueous sample into 2 μL of organic solvent by single drop micro extraction (SDME). • Solvent: Octanol • Stirring speed: 200 rpm • Extraction time: 7 min • Acceptor phase volume: 0.8 μL • No salt addition • At room temperature Then, it was analyzed by AP-MALDI-MS
The enrichment factor for CS+ was found to be 40-64 folds for 7 min of extraction at room temperature. The linearity and limit of detection (LOD) of the method were 50-1500 and 10 μg/L, respectively. • The relative recoveries in river and municipal waste water were found to be 95.2 to 105 % and 90.0 to 100 % respectively and this shows good reliability of the method. • The enrichment and LOD values obtained by SDME were compared with LLE and HF-LPME, and found SDME is compatible with HF-LPME and much better than traditional LLE.
INTRODUCTION Cationic surfactants (CS+) are surface-active compounds with at least one hydrophobic alkyl chain and a hydrophilic group carrying a positive charge. CS+ are positively charged in aqueous solutions. A positively charged quaternary nitrogen atom characterizes the quaternary ammonium compounds. Hydrophobic (water repelling) Hydrophilic (water loving) CH3 H3C N + CH3 CH3 Head Tail
CS+ are used: • Hair rinsers & Textile softener • Preservatives or antiseptic agents in industrial and commercial products. • Due to their ability to stabilize emulsions and their antibacterial properties, surfactants used widely in cosmetics, drugs and microbiocides. • CS+ are also widely used in the manufacture of commodity samples, i.e. detergents, soaps, shampoo, etc. as surface cleaning agents
Toxicities of CS+ • CS+ are toxic to aquatic invertebrates as indicated by study of Belanger et. al. • The few available absorption studies conducted with CS+ indicate that absorption occurs in small amounts through the skin. • CS+ also can causes, i.e. nausea, vomiting, diarrhea, dermal necrosis, lung complications, hypotension, corneal damage.
The most common method to determine CS+: • Spectrophotometry • High performance liquid chromatography (HPLC) • Electrospray ionization mass spectrometry (ESI-MS) • Capillary electrophoresis (CE) • Ion pair chromatography (IC)
Sample preconcentration and extraction of analytes Liquid-liquid extraction (LLE)is one of the old conventional methods used for extraction of analytes from various matrices. Drawbacks: more solvent consumption, tedious, time consuming and exposure of toxic chemicals during operation.
Application of Matrix-assisted laser desorption /ionization-mass spectrometry • Powerful sensitive technique: Proteins, nucleic acid, drugs and synthetic polymers. • Major advantages of the technique: simplicity of usage, high sensitivity and high sample throughput. • Quantitative analysis of different analytes using internal standard. • The properties of internal standard should be chemically similar to the analyte, completely resolved from the analyte peak and internal standard should be near to the sample of analyte.
Atmospheric pressure-matrix assisted laser desorption/ionization mass spectrometry (AP-MALDI/MS) All mass spectra were collected in positive ion mode by using an AP-MALDI ion source (Mass Tech Inc., Columbia, MD, USA) in conjunction with an ion trap mass spectrometer (Thermo Finnigan LCQ-Advantage, San Jose, CA, USA). Analytes were irradiated with a nitrogen laser at 337 nm. Bombarding of laser beam on target plate was fixed for 1 min at 1.8 kV for all spectra and mass range was set at 100-600 Da. The laser power was operated at 10 Hz. The voltage of capillary and tube lens offset was 40 V and 70 V, respectively. The temperature of capillary was constant at 250 oC. Mass spectra were obtained by summing all individual shots.
RESULTS AND DISCUSSION Simultaneously quantitative analysis of cationic surfactant mixtures by AP-MALDI mass spectrometry • MALDI/MS is difficult in the analysis for low molecular weight compounds (MW < 500 Da). This is due to the interference of matrix ions. • In this study, the determination of mixtures of CS+ including CTAB, CPC and MTOAC from water samples was easily performed since the matrix ions of CHCA were suppressed in the presence of the surfactants.
[M-Br-]+ofTOAB (IS) 466.7 Figure 8 [M-Cl-]+of MTOAC Abundance 368.5 [M-Cl-]+ of CPC [M-Br-]+ of CTAB 284.5 304.3 m/z Figure 4 presents the SDME/AP-MALDI mass spectra of CS+. The ions shown at m/z 284.5, 304.3, 368.5 and 466.7 were assigned as [M-Br-]+ of CTAB, [M-Cl-]+of CPC, [M-Cl-]+ of MTOAC and [M-Br-]+of TOAB, respectively. These ions were produced by elimination of a halogen ion (Br -, Cl -) from the molecular ion.
Optimization of extraction parameters for single drop micro extraction (SDME) • Efficient extraction of CS+ into organic acceptor phase (organic solvent) was obtained by optimizing sampling conditions. • Extraction solvent, stirring speed of sample, extraction time, acceptor phase volume and salt addition. • The extraction efficiency was based on the abundance of each analyte for three replicate analyses.
Enrichment factors, calibration curve and precision • Enrichment factor is ratio of concentration between organic solvent and aqueous phase used for extraction. Enrichment factors were determined to know extraction efficiency of CS+ at optimal conditions. • Signal intensity of calibration and internal standards were recorded at positive ion mode in AP-MALDI-MS. The ratio of signal intensity of analyte to internal standard were calculated and used to draw calibration curve.
The LOD were calculated as the amount of compound that would still give signal three times than the noise. The LOD for all surfactants were found to be 10 μg /L. • For quantitative AP-MALDI/MS analysis of CS+, an internal standard was required to improve reproducibility of the results. • The precision of the method was expressed as the relative standard deviation (RSD) of replicate analyses (n=6), at concentration of 1 mg/L carried out within working day.
Table 1. Linearity, correlation coefficient, limit of detection and enrichment factor of the SDME/AP-MALDI/MS method for determination of cationic surfactants in deionized water. Surfactant Linear range (μg/L) r2 LOD (μg/L) Enrichment factor RSD, % (n=6) [M-Br-]+ of CTAB 50-1500 0.996 10 40 10.6 [M-Cl-]+ of CPC 50-1500 0.987 10 64 12.0 [M-Cl-]+ of MTOAC 50-1500 0.997 10 55 9.6
Table 2. Determination of cationic surfactants in river and municipal waste water by using the SDME/AP-MALDI/MS method. Sample [M-Br-]+ of CTAB (μg/L) RSD, % (n=3) [M-Cl-]+of CPC (μg/L) RSD, % (n=3) [M-Cl-]+ of MTOAC (μg/L) RSD,% (n=3) RW 93 12.0 58 8.9 ND ND MWW1 51 8.3 115 12.3 ND ND MWW2 90 10.0 34 14.4 ND ND MWW3 46 12.3 84 10.1 18 8.3 Application
Table 3. Determination of relative recoveries for cationic surfactants in river and municipal waste water by using the SDME/AP-MALDI/MS method. 50 μg/L 100 μg/L Recovery, % RSD, % (n = 3) Recovery, % RSD, % (n = 3) River water [M-Br-]+ of CTAB 95.4 11.5 95.2 6.7 [M-Cl-]+ of CPC 95.1 12.4 99.0 12.0 [M-Cl-]+ of MTOAC 93.1 12.8 105 12.2 Municipal waste water [M-Br-]+ of CTAB 98.0 9.6 97.7 6.4 [M-Cl-]+ of CPC 91.4 10.0 100 11.1 [M-Cl-]+ of MTOAC 90.0 10.2 93.5 11.8 • Relative recoveries were estimated as intensity ratio of CS+ in matrix sample to the intensity in deionised water spiked of same amount of analytes.
Table 4. Comparison of LOD and enrichment factors of SDME with HF-LPME coupling to AP-MALDI/MS for cationic surfactants in deionized water SDME HF-LPME Enrichment factors LOD (μg/L) (μg/L) Enrichment factors LOD (μg/L) [M-Br-]+ of CTAB 40 10 48 8 [M-Cl-]+ of CPC 64 10 54 8 [M-Cl-]+ of MTOAC 55 10 62 5 • Table 4 displays the comparison of LODs and enrichment factors of SDME with HF-LPME coupling to AP-MALDI/MS for cationic surfactants in deionized water. The LODs for SDME and HF-LPME were 10 and 5-8 μg/L, respectively. • The LOD values obtained by SDME were compatible with the HF-LPME. The enrichment factors obtained by HF-LPME were 48 to 62 folds, which were comparable to SDME. • However, the SDME is more convenient and lower cost than the HF-LPME since no hollow fiber is required in the extraction processes.
CONCLUSION SDME combined with AP-MALDI-MS • proved to be a simple, rapid, and selective method for the simultaneous quantitative determination of cationic surfactants from river and municipal waste water. • Large number of water samples could be screened in short period of time to know exposure of these cationic surfactants in the environment. • This effort could be certainty helpful for quality control of pollution in different compartments of the environment.