Download
1 / 19
190 likes | 287 Views
User-centered Navigation Re-Design for Web-based Information Systems. Michael Hahsler, Department of Information Business, Michael.Hahsler@wu-wien.ac.at Bernd Simon, Department of Information Systems, Bernd.Simon@wu-wien.ac.at Vienna University of Economics and Business Administration

E N D
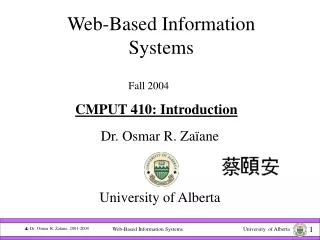
User-centered Navigation Re-Design for Web-based Information Systems Michael Hahsler, Department of Information Business, Michael.Hahsler@wu-wien.ac.at Bernd Simon, Department of Information Systems, Bernd.Simon@wu-wien.ac.at Vienna University of Economics and Business Administration Presented at the AMCIS 2000
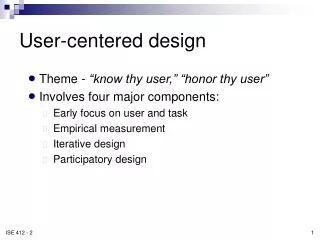
Aim - The Project Create a new navigation structure for the university´s home page. • Organize web objects • Hierarchical classification scheme/directory structure • Existing classification schemes (NAICS, ACM) • Developement of a custom hierarchical directory structure with user participation
Rational for User Participation • Increased usability - the structure developed reflects the way users would organize information. • Reduced subjectivity - the influence of the developers and interest groups is kept to a minimum. • Higher level of acceptance - user participation in the design process results in a higher level of acceptance of the final web design.
Audience Web objects definition identification Card sorting Re-design of the logic structure Category identification Category evaluation Model representation Implementation Model visualization Usability testing Roadmap for Re-design First part is based on Fuccella and Pizzolato, ITG Newsletter 1998
Audience Web objects definition identification Card sorting Re-design of the logic structure Category identification Category evaluation Re-Design of the logic Structure logic Model
Re-Design of the logic Structure I • Audience definition - find target groups. • Traditional market research data • Log file analysis • User surveys • Web object identification - what information is needed/available? • Top-hits list from log file analysis • User survey • Analysis of search engine queries (missing objects) • Time restrictions: Selection of representative objects
Re-Design of the logic Structure II • Card sorting - case studies to understand the users´ concept of how information should be organized. • Group cards into sets and name the sets • Appr. 100 cards take 30 minutes • 5 to 10 users per target group
Re-Design of the logic Structure III • Category identification - the project team compiles a preliminary logic structure. • Identify categories needed plus structure • Specify category labels • Provide accurate categorydescription (maintenance handbook)
Re-Design of the logic Structure IV • Category evaluation - do the category labels and descriptions reflect the users´ concept? • User survey: Provide the users with the category structure and ask them where they would expect to find several web objects in this structure. • Consensus rate >70% (Fuccella and Pizzolato) • Low consensus rate: Categories and descriptions are inappropriate. Go back to category identification.
Model representation Implementation Model visualization Usability testing Prototype Implementation logic Model
Prototype Implementation I • Model Representation - directed acyclic graph.
Prototype Implementation II • Visualization - e.g. multilevel overview
Prototype Implementation III • Usability testing • Expert review, 5-8 users per group identify 80% of usability flaws. • User test • See literature.
Audience Web objects definition identification Card sorting Re-design of the logic structure Category identification Category evaluation Lessons Learned
Lessons Learned I • Audience definition • If user groups exhibit fundamentally different needs (students, staff members), divide the navigation structure. • Web object identification • Top-hits lists from log files are often misleading (technical and organizational reasons). • We used the user survey for the category evaluation also to verify the top hits list.
Lessons Learned II • Card sorting • We used too many cards (120) which took longer than 40 min. • We only used printed cards. • We had 20 users (10 students, 10 staff) to sort cards; they made quite different suggestions. • Better: Use computer based tools; if possible web-based tools (no installation) to get a bigger sample • Use random or stratified sample to reduce needed time.
Lessons Learned III • Category identification • The more users do card sorting, the more difficult is category identification. • Use many users for card sorting (web-based) + support category identification with cluster analysis tools as opposed to the case study approach. • Category evaluation • We surveyed 1,140 users (929 students, 182 staff, 21 unidentified) to verify classification for about 120 web objects (online questionaire). • For most web objects consensus rate was significantly below 70%.
Usage for E-Commerce Sites • Find or improve a usable structure for: • Services offered by companies to its employees. • Many different products/services offered by B2B and B2C sites. • Services and Information offered by a broker.