Download
1 / 29
290 likes | 392 Views
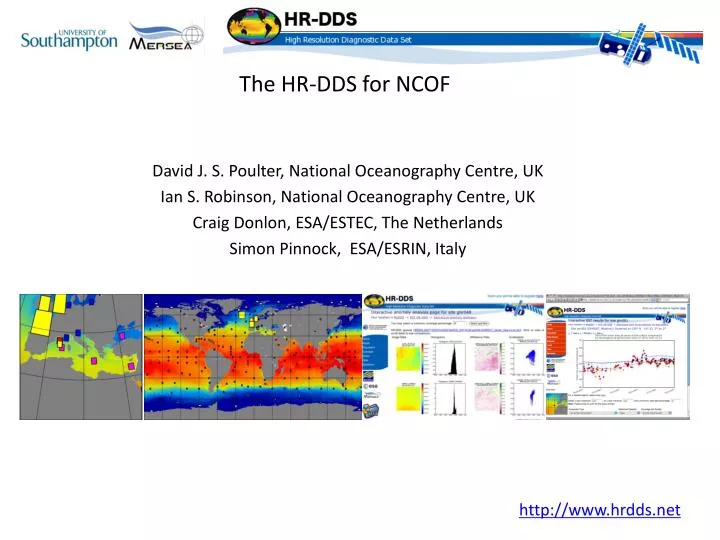
The HR-DDS for NCOF. David J. S. Poulter, National Oceanography Centre, UK Ian S. Robinson, National Oceanography Centre, UK Craig Donlon, ESA/ESTEC, The Netherlands Simon Pinnock, ESA/ESRIN, Italy. http://www.hrdds.net. GDAC. MMR. L2P. MDB. Users. Internet. internet. MMR-FR. HR-DDS.

E N D
The HR-DDS for NCOF David J. S. Poulter, National Oceanography Centre, UK Ian S. Robinson, National Oceanography Centre, UK Craig Donlon, ESA/ESTEC, The Netherlands Simon Pinnock, ESA/ESRIN, Italy http://www.hrdds.net
GDAC MMR L2P MDB Users Internet internet MMR-FR HR-DDS L2P HR-DDS MDB records in situ data Archivingsystem HR-DDS extraction External data centres L2 HR-DDS extraction Collocation Internet L2P, UHR/L4 Product consolidation Optimal interpolation DV correction L2P L2 L2P L2P UHR/L4 Ancillary data The MERSEA / MyOcean system (incorporating GHRSST / Medspiration) http://www.hrdds.net
Development of the HR-DDS The High Resolution Diagnostic Data Set is a tool developed within MERSEA and the GHRSST project. It is designed to facilitate validation of operational data sets: L2 / L2P Satellite SSTs L4 analysis products Model SST fields Climatologies In situ observations And to allow interactive expert and layman analysis of individual observations or product files. Originally, the system was designed to provide validation and analysis systems for SST products only. http://www.hrdds.net
Development of the HR-DDS At many sites in the global ocean a subset is produced every observation made in any of approximately 40 input data streams. These are all available for interactive analysis at the HR-DDS website http://www.hrdds.net
Analysis with the HR-DDS A large database holds a statistical representation of all data within the HR-DDS archive. This is instantaneously available to the web portal and hence to the user. http://www.hrdds.net
Product comparison example Individual observations may be interactively compared to identify any problems with that file. http://www.hrdds.net
Analysis of L4 products. A detailed inter-comparison of L4 products was undertaken. The HR-DDS allowed for easy analysis of general trends and behavior. Standard deviation of OSTIA to AATSR (0.25 K) Mean Bias of OSTIA to AATSR (0.01 K) http://www.hrdds.net
Analysis of NCDC AVHRR L4 products. http://www.hrdds.net
Analysis of NCDC AVHRR L4 products. http://www.hrdds.net
Further Analysis of L4 Identification of the causes of biases in specific regions with specific analysis is greatly improved by looking at detailed high resolution imagery. The HR-DDS (as part of the GHRSST project) is developing new tools for the analysis of L4 products, including a dedicated L4 portal, as a contribution to the GEO (Group on Earth Observations) Action DA-06-03. http://www.hrdds.net
Further Analysis of L4 Identified a failure of OSTIA to assimilate any data in the Caspian Sea until AATSR values had reduced to within 5 K of Levitus climatology. In this case Levitus was extremely warm biased. http://www.hrdds.net
Further Analysis of L4 Using the HR-DDS NOCS identified a spatial anomaly in early OSTIA SSTs http://www.hrdds.net
Further Analysis of L4 This manifested itself as a power anomaly at 25 km wavelengths – was later traced to a bad ingestion operator for TMI data from Medspiration. http://www.hrdds.net
Further Analysis of L4 This manifested itself as a power anomaly at 25 km wavelengths – was later traced to a bad ingestion operator for TMI data from Medspiration. http://www.hrdds.net
Behavior of FOAM SST The HR-DDS identified 14 day cycle in FOAM SST bias when compared to PIRATA SST.. http://www.hrdds.net
Behavior of FOAM SST The HR-DDS identified 14 day cycle in FOAM SST bias when compared to PIRATA SST.. http://www.hrdds.net
Analysis of L2P files The HR-DDS is particularly useful in establishing the errors introduced introduced by processing data in different ways. These two graphs show the bias from AATSR of two versions of NOAA-17 AVHRR data. The observations used are the same http://www.hrdds.net
Examples of L2P product validation. The HR-DDS allow for both upstream and downstream users to assess each product. For example, the availability of ancillary data can easily be shown: Aerosol Optical Depth and Surface Solar Irradiance for AATSR L2P products in 2007. Note a general improvement in performance. http://www.hrdds.net
Examples of error detection and classification The HR-DDS is able to can be used to identify the causes of errors in SSTs. During a recent NOCS / OSI-SAF (Met.no and CMS) collaboration the HR-DDS identified cold biases in METOP-A SSTs during local evening conditions. The HR-DDS allowed us to identify a link with a discrete range of solar zenith angles, 85 to 90. Not every pixel in this range was biased, but all bias pixels where in this range. http://www.hrdds.net
Examples of error detection and classification In this case we where able to propose a a correction which removes a significant proportion of these errors http://www.hrdds.net
Examples of error detection and classification Recently the Met Office suspected an introduced warm bias in an analysis product. The HR-DDS was able to confirm the introduced bias… …and the suspected cause of this bias. http://www.hrdds.net
Role in diurnal variability studies The HR-DDS is also being used to study distribution of diurnal variability. Allowing us to identify area where DV may be predictable… …and where it isn’t. http://www.hrdds.net
Diurnal effect correction This plot shows the observed diurnal warming events for approximately 3 years in one site of the Mediterranean. http://www.hrdds.net
Diurnal effect correction This plot shows the data remaining after application of the present OSTIA filtering. http://www.hrdds.net
Diurnal effect correction This shows the effect of an experimental correction derived from analysis of the HR-DDS database. The HR-DDS indicates that 99.5% of SEVIRI obs over the PIRATA locations are filtered out by the present OSTIA DV scheme. http://www.hrdds.net
User services (now) The HR-DDS system allows users to register, gaining access to further services: User configured plots and analysis tools User defined search parameters Record interactive bookmarks Collaborative pages (i.e. There is a page for the OSI SAF, focusing on METOP-A validation) http://www.hrdds.net
Collaborative Groups http://www.hrdds.net
User services (MyOcean and others) Within the context of Kopernicus, and the UK NCOF partnership: Automatic reporting of “events” to registered users Ingestion of Wave and Chlorophyll observations (in fact both included pre-operationally) Inclusion of in situ observations Coriolis MyOcean MDB Dynamic linking to MDB frontend Further collaborative features (Facebook style messages, walls and groups) Many others in the context of GHRSST and GEO. http://www.hrdds.net
Thanks! Much of the development shown today was made possible through funding and support from the NCOF partnership in the UK. Specific thanks must go to the Met Office for their continuing support (Craig Donlon, Adrian Hines, Mike Bell). The HR-DDS was originally developed as part of the ESA Medspiration project. Some additional support has been received from the UK government through BNSC and DEFRA. This talk has shown work undertaken in collaboration with John Stark (ex Met Office) and Steinar Eastwood (Met.no). http://www.hrdds.net