Download
1 / 69
750 likes | 898 Views
An Introduction to Vocal Acoustics and Spectrographic Analysis. Dr. Philip Sargent Vocal/Choral Division Shenandoah University. What is Sound. What we can hear Vibrations (pressure variations) that can produce the sensations of hearing 20-20,000 Hz (Hertz or cycles per second)

E N D
An Introduction toVocal AcousticsandSpectrographic Analysis Dr. Philip Sargent Vocal/Choral Division Shenandoah University
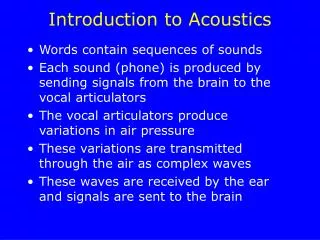
What is Sound • What we can hear • Vibrations (pressure variations) that can produce the sensations of hearing • 20-20,000 Hz (Hertz or cycles per second) • Travels through a medium • Displacement and velocity of medium molecules correspond to the pressure variations
Nature of Sound • Vibration • Travels as waves of compression/rarefaction • Actual medium doesn’t move far; it just oscillates in place
Nature of SoundOscillating systems demos • Pendulum • What changes when string is shortened? • What changes when weight is increased? • Spring and mass • What changes when spring is stiffened? • What changes when weight is increased?
Nature of Sound • Vibration • Travels as waves of compression/rarefaction • Actual medium doesn’t move far; it just oscillates in place • Travels at a constant speed (1130 fps) • Speed dependant on the conducting medium • Faster through helium, steel, water, than air • 335 m/s in normal air; 350 m/s in the throat
Nature of Sound • Vibration • Travels as waves of compression/rarefaction • Actual medium doesn’t move far; it just oscillates in place • Travels at a constant speed (1130 fps) • Speed dependant on the conducting medium • May form a repetitive pattern (or not) • Travels in all possible directions
Basic properties of sound • Duration • Amplitude • Quality • Direction or apparent location/source (psycho-acoustic property)
Basic properties of sound • Duration – measured by: • Tempo and rhythm • Actual length (minutes, seconds. milliseconds) • We are most interested in events measured in: • Seconds • Milliseconds (ms)
Basic properties of sound • Duration • Amplitude - measured by: • Dynamics • Fixed power units (e.g. Watts/meter2 ) • Decibels (logarithmic = similar to the way we perceive loudness and pitch) • Phons – measures perception of intensity (loudness) • Not used much in scientific studies – too subjective
Basic properties of sound • Duration • Amplitude • Quality • Due to multiple frequencies being perceived as a single quality (Casio demo) • Displayed as frequency spectrum • Instrument identification, timbre • Registration • Vowel recognition
Basic properties of sound • Duration • Amplitude • Quality (and possibly pitch) • Direction or apparent location/source • Result of simultaneous perception of slightly different sounds (Stereo, 5.1)
Basic properties of sound • Duration • Amplitude • Quality • Due to multiple frequencies being perceived as a single quality (non-harmonic synthesis demo) • Can be displayed as frequency spectrum • Voice type and gender identification; timbre • Registration • Vowel recognition
Pitched and Non-pitched Sounds • Non-pitched • Impulse ([t],[k], clap, pop) • Random ([s],[f], hiss, white and pink noise) • Pitched • Repeating pressure variation pattern (waveform) • Perceivable pitch (frequency) • Period and wavelength (Boxcars at the Xing)
Pitched Sounds Simplest = Sine wave
Pitched Sounds • Simple = Sine wave • Pendulum • single spring and mass • Complex = • Vowels, sustained instrument tones • Non-harmonic = struck instruments • Harmonic = Voice, strings, winds, ‘piano’ Remember harmonics?
Pitched SoundsThe Harmonic Series • Fundamental (F0 or F0) • called ‘F sub zero’ or ‘F zero’ • Lowest frequency partial • Same as first harmonic (H1) • Perceived as the sound’s pitch (even if it’s not there!) • Overtones • Integral multiples of fundamental’s frequency • Produce regular pattern of musical intervals • Not all present in every sound • Progressively weaker than fundamental
Pitched Sounds: Building acomplex wavefromharmonics(sine wave components) Backus 1969
a Sawtooth or a Square wave Backus 1969 Adding harmonics to build
Pause to studyVoceVistaProWindows and Interface Waveform Spectrogram Power Spectrum EGG - later
VoceVista and Fourier • Jean Baptiste Joseph Fourier (1768 – 1830) • All repeating wave patterns can be analyzed / synthesized as a sum of sine waves • FFT displays the energy distribution in a complex wave by frequency • In mathematics, the discrete Fourier transform (DFT) converts a finite list of equally-spaced samples of a function into the list of coefficients of a finite combination of complex sinusoids, ordered by their frequencies, that has those same sample values. It can be said to convert the sampled function from its original domain (often time or position along a line) to the frequency domain.
VoceVista Analysis Settings Narrowband vs. Wideband LTAS Control-Drag for Hz and vibrato rate Time and frequency range settings Reference lines Ctrl-F1, F2, F3 for over/under & overlay F1-8 window choices Grayed out controls and Reset
Source/Filter Model of the Voice • Source • Lungs, and breathing muscles • Larynx (Vocal folds) • Filter • Vocal tract • Laryngeal spaces • Nasal passages • Trachea and bronchial tubes?
Source – Breath Management • Subglottic pressure (Psg) • Cm H2O, KPa, other units • Volume of air (Transglottal airflow) • litres/second • Must balance effort against the natural elasticity of the breathing apparatus
Source – Breath Management elasticity of the breathing apparatus Sundberg 1987
Source – Breath Management Subglottic pressures Sundberg 1987
Psg vs. dB for various phonations Sundberg 1987 Pressure dB 14cm 70dB 9cm 76dB 8cm 78dB 5cm 68dB
Source – Vocal Folds • Series of glottal puffs • Psg overcomes glottal resistance • Transglottal airflow begins • Bernoulli effect and restorative tension in folds close glottis • Pattern repeats • Vocal folds may thin or thicken vertically depending on CT/TA balance
Sundberg SSV 1987 Sundberg 1987
Source – Vocal Folds Sundberg 1987
Source – Vocal Folds Sundberg 1987
Source – Vocal FoldsExamining the Trans-glottal flow • EGG • Measures conductivity between folds • Correlates with open/closed phase • Inverse filtering • Removes effect of Vocal Tract resonances • Result is the glottal waveform as flow
Pause to studyVoceVistaProEGG Window and Interface • EGG • Polarity and order of input • Scrolling to set EGG/microphone delay • Setting Criterion Level • CQ + OQ = 1
Source – Vocal Folds Source – Vocal Folds Sundberg 1987
MFDR and Loudness Sundberg 1987
Source – Vocal Folds (continued) • Glottal waveforms differ with changes in registration • Falsetto – longer open phase – nearly sinusoidal • Soft head voice – long open phase • Chest/operatic – long closed phase • Belt – longer closed phase – most high harmonic content
Source to Filter • Series of glottal puffs • Vocal fold closure generates oscillations (standing waves) in the tube (vocal tract) • Faster closure = less spectral slope (MFDR) • Total/peak trans-glottal flow affects relative F0 strength
Source to Filter • Open and closed phase resonate differently • Closed phase • Standing wave is moderately dampened • Higher CQ values important to UE (D. Miller) • Allow stronger source H3 (& H4 if CQ >.80) • Open phase • Rapid loss of wave energy • heavily dampens the standing wave • Subglottal cavities become part of the filter
Source/Filter Interaction:String instruments • Pitch determined by • Length • Tension • Thickness (mass/length) • Pitch independent of resonator’s characteristics • = Loosely coupled • All overtones present in diminishing strength
Source/Filter Interaction: Wind instruments • Sound produced by: • Edge tone (flute, recorder) • Vibrating reed (clarinet, oboe) • Lips buzzing in a mouthpiece (brass) • Pitch dependant on resonator (largely tube length) =Tightly coupled, esp. in Woodwinds • Output may contain all or just odd partials (based on resonator shape)
Source/Filter Interaction: Vocal Inertance • Increasing supraglottal resistance to flow may aid in glottal closure • Non-linear system –Titze • Tightly coupled - Vennard
Filter – Vocal Tract • Voice • Very irregular tube / coupled cavities Bottle Demo • Cavity (Helmholtz) resonance • Pitch factors • Cavity size • Neck length • Neck diameter • Shape can affect narrowness of response • Resonator wall condition – affects efficiency/attenuation • Coupling of resonators
Formants • Fixed pitch areas of resonance • Affect amplitude of overtones • Dependant on frequency, NOT the number of the harmonic • Like the tone controls on a stereo or equalizer
Formants, Continued • Singer’s Formant - Clustering of F3, F4, & F5 around 2800 Hz • Vowels - F1, F2, and perhaps F3 • Formant cavities in front and behind tongue hump –S.P.P.1 Demo • IPA Formant Frequencies • (PSS, spoken) (PSS, sung G3) • /i/ 350 1800 400 1500 • /e/ 350 2000 400 1600 • /ε/ 525 1700 550 1300 • /æ/ 600 1600 650 1400 • /a/ 650 1100 650 1100 • /o/ 350 650 425 750 • /U/ 400 950 500 700-900 • /u/ 300 700 450 700-900
Sundberg 1973 Loudness Curves
Backus 1969 Simplified Loudness Curves