Download
1 / 59
620 likes | 1.18k Views
What is a Fiscal Policy?. Government spending and taxation to achieve full employment without inflation. © 1999 South-Western College Publishing. Legislative Mandates. Employment Act of 1946 Federal Governments responsibility to ensure price stability and full-employment

E N D
What is a Fiscal Policy? • Government spending and taxation to achieve full employment without inflation ©1999 South-Western College Publishing
Legislative Mandates • Employment Act of 1946 • Federal Governments responsibility to ensure price stability and full-employment • Utilize Fiscal and Monetary policy to achieve this goal
Who decides to Tax or Spend?? • The legislative branch – It is in the Constitution – Article 1 • The President proposes a budget each year during the “State of the Union address”. • Congress approves/denies some or all of the budget. • Increases or decreases in Taxes must be passed by the House of Representatives.
Everyone has a budget – even the Federal Govt. Revenues = Spending Balanced Budget Revenues > Spending Budget Surplus Revenues < Spending Budget Deficit • Revenues mainly from Taxes. Some comes from Tariffs, fees, and other levies on goods and services
Americans are living longer and having fewer children Consequently, fewer workers are available to support each Social Security recipient 2040: 2 to 1 Today: 3.3 to 1 1960: 5.1 to 1 Source: Social Security Administration, March 2006
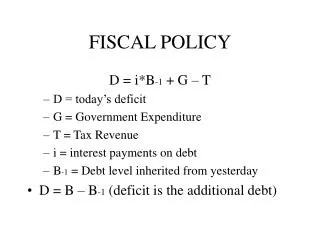
Difference between Deficits and Debt • Deficit - when a budget is created and spending is greater than revenues. • Debt - the accumulated borrowing to cover deficits. • National Debt (estimate) - $8,981 Trillion.
Relevant Numbers on Federal DebtAugust 24, 2007 Information comes from the Concord Coalition www.concordcoalition.org/issues/feddebt/debt-facts.html
The National Debt: • As of August 24, 2007, the total outstanding debt was $8.981 trillion, which is approximately 65% of U.S. Gross Domestic Product. This amounts to a share of over $29,000 per citizen. • The Congressional Budget Office (CBO) August 2007 baseline projects that the national debt will exceed $10 trillion by 2010 and will reach $12.870 trillion in 2017 • The national debt can be divided into $5.055 trillion of publicly held debt (domestic and foreign), and $3.926 trillion of debt held by government accounts (trust funds), the largest of which is Social Security. • Because trust fund debt is a matter of internal governmental bookkeeping, economists focus on the publicly held debt. It is this number that reflects the impact of federal borrowing on the economy and the budget.
Publicly Held Debt: • The publicly held debt is currently $5.055 trillion, a historic high in nominal terms. • A more important measure of the debt is its size in relation to the nation's economy, generally stated in terms of Gross Domestic Product (GDP). In CBO's baseline projection, accumulated federal debt held by the public will equal 36.4% of GDP in 2007.
Publicly Held Debt: • Roughly 90 percent of the publicly held debt consists of marketable securities--Treasury bills, notes, bonds, and inflation-indexed issues (called TIPS). The remaining 10 percent comprises non-marketable securities, such as savings bonds and securities in the state and local government series, which are nonnegotiable, nontransferable debt instruments issued to specific investors. • By 2017, CBO projects publicly held debt to equal 25.2% of GDP. If materialized, this would be a post-World War II low. Previously, its post-World War II high was 109% of GDP in 1946, and its post-WWII low was reached in 1974 at 24% of GDP.
Publicly Held Debt: • Under the Government Accountability Office's (GAO) Long-Term Budget Scenario, publicly held debt will be 62.7% of GDP by 2020 and 250.3% of GDP by 2040.
Foreign Holdings of Debt: • As of June 2007, domestic investors owned 55% ($2.724 trillion) of outstanding public debt and foreign investors held 45% ($2.219 trillion) of outstanding public debt. • The amount of the debt held by foreigners is at a historic high. As of June 2007, foreign investors held $2.219 trillion of Treasury Securities, $1.469 trillion of which is held by official institutions. • As of June 2007, Japan and China were the two largest foreign holders of treasury securities with $612.3 billion and $405.1 billion respectively • Foreign holdings of Treasury securities have increased by more than $1.049 trillion since 2000.
Interest on the Publicly Held Debt: • Every borrowed dollar carries an interest cost. The most direct impact of public debt on the federal budget is, therefore, the amount of money taxpayers must come up with each year to finance past borrowing. • According to the CBO August 2007 Baseline, net interest on the publicly held debt in fiscal year 2007 is expected to equal $235 billion -- roughly 8.6% of the federal budget. • Spending for interest on the debt in fiscal year 2007 ($235 billion) is expected to equal 20.1% of all personal income tax revenue and more than the entire federal share of the Medicaid program in fiscal year 2007 ($192 billion).
Interest on the Publicly Held Debt: • During the 1980s and 90s, before the 1998-2001 surpluses, interest regularly consumed 13 percent or more of the federal budget a year, reaching a high point of 15.4 percent in 1996. • For fiscal year 2007, net interest on the publicly held debt is expected to equal 1.7 percent of GDP. Its recent high point was 3.3 percent of GDP in 1991. • Under GAO's long-term budget scenario, net interest costs will reach 2.9% of GDP by 2020 and 11.6% of GDP by 2040.
Trust Fund Debt: • While trust fund debt does not have the same economic and budgetary effects as publicly held debt, it is nevertheless a relevant, if incomplete, indicator of future burdens such as Social Security, Medicare and federal government pension payments. • As explained by the GAO: "Because debt held by the trust funds is neither equal to future benefit payments, nor a measure of the commitments of the current system, it cannot be seen as a measure of this future burden. Nevertheless, it provides an important signal of the existence of this burden." [1] • As a technical matter, trust fund balances are credited with interest. However, trust fund interest is simply a credit of IOUs to the respective trust fund. It does not involve an outlay of federal dollars and thus has no economic or budgetary effect.
Trust Fund Debt: • According to the July 2007 Monthly Treasury Statement, the five largest trust funds are: • Social Security's Federal Old Age and Survivors Insurance, $1.965 trillion. • Civil Service Retirement, $677 billion. • Department of Health and Human Services Federal Hospital Insurance, $320 billion. • Social Security's Federal Disability Insurance, $210 billion. • Military Retirement Fund, $194 billion
Gross Debt and the Statutory Limit: • The debt subject to limit is the maximum amount of money the government is allowed to borrow without receiving additional authority from Congress. • The current statutory debt limit is $8.965 trillion. • Congress has approved three increases in the statutory debt limit totaling $3.015 trillion since 2002. • The most recent legislation adopted by Congress provided for an additional $781 billion increase in the debt limit
What is the Federal Budget today? • http://www.heritage.org/Research/Budget/upload/83722_1.pdf
Two types of Fiscal Policies of Spending and Taxation • Discretionary Fiscal Policy • Changes in Taxes or Spending at the “option” of the Federal Government. • These changes do not occur automatically- they must be legislated. • Spending on the War on Terrorism, poverty programs, Student financial aid, Homeland Security, etc. • Tax cuts for the “wealthy”, Capital gains taxes, change in Social Security/Medicare taxes
Discretionary Spending 08’ • Go to this website for interactive poster www.thebudgetgraph.com/poster/
The Two types of Fiscal Policies Spending and Taxation • Nondiscretionary Fiscal Policy • Built-in stabilizers -automatic changes in G and T as the economy changes. • These do not require new legislation – already embodied in law • In a Recession – Government spending for some programs INCREASES. As the economy improves, spending for these programs DECREASES • Examples: Unemployment Compensation, Food Stamps, Social Security, Medicare • Progressive Tax System • In a Recession– Incomes decline and people pay less of there income in taxes - retain more to spend • During periods of Inflation, as incomes rise people pay more of their income in taxes – now they have LESS to spend
Net Interest Discretionary Mandatory Mandatory spending is consuming a growing share of the budget 27% 44% 42% 38% 54% 66% 7% 8% 14% Source: Congressional Budget Office, October 2006 NOTE: Numbers may not add up due to rounding.
Change in composition of discretionary spending 34% 39% 50% 50% 66% 61% Defense Non-defense Source: Congressional Budget Office, October 2006
Progressive Tax Structure and You What this means… If you do your taxes and after Credits and Deductions your Adjusted Gross Income is $100,000 (pretty good, huh!) On your first 7,550 you pay 10% = $755 From $7551 to $30,650 you pay 15% =$3,465 From $30,361 to $74,200 you pay 25% = $10,960 From $74,201 to $100,000 you pay 28% = $7,224 Total Federal Income Tax $22,404 You are in the 28% Tax Bracket, BUT your Effective Tax Rate is 22.40%
Who bears the burden of Federal Income Taxes?? Percentiles Ranked by AGI Adjusted Gross Income Threshold on Percentiles Percentage of Federal Personal Income Tax Paid Top 1% $364,657+ 39.38% Top 5 % $145,283 59.67% Top 10% $103,912 70.30% Top 25% $62,068 85.99% Top 50% $30,881 96.93% Bottom 50% < $30,881 3.07%
How many days do we work to pay our taxes? • www.taxfoundation.org/taxfreedomday/
What is aRecessionary Gap? • The amount by which Aggregate Demand falls short of a full employment equilibrium, thus giving high unemployment ©1999 South-Western College Publishing
AggregateDemand/Aggregate Supply Recession (AS) SRAS (Fe) Price Level P(1) (AD) Full Employment (Fe) LRAS GDP1 Recessionary Gap Gross Domestic Product
Fiscal policy to help solve a recessionary gap • Raise government spending • Lower taxes • Attempting to expand or stimulate the economy • Remember, multiplier effects • “EXPANSIONARY” REMEMBER We want to get Aggregate Demand moving to the Right – Increasing GDP AD
What is anInflationary Gap? • The amount by which Aggregate Demand exceeds the full employment equilibrium, thus a booming economy, leading to demand pull inflation. ©1999 South-Western College Publishing
AggregateDemand/Aggregate SupplyInflation (AS) SRAS Inflationary Gap (Fe) Price Level P(1) (AD) This is where we want to be!! Full Employment (Fe) LRAS Gross Domestic Product