Download
1 / 4
40 likes | 208 Views
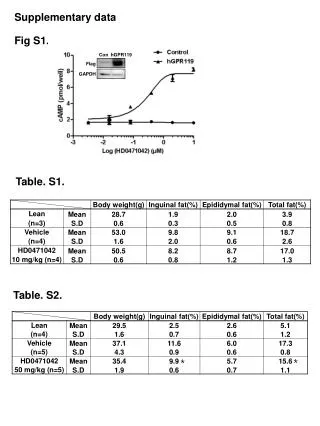
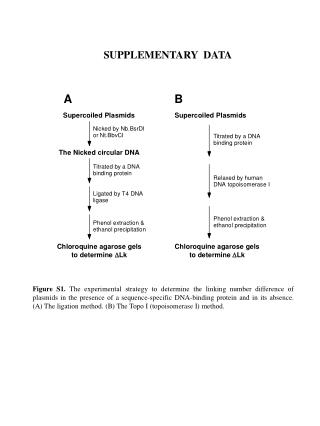
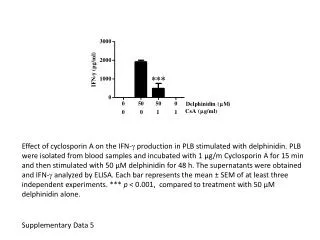
Supplementary Data Average Monosaccharide Composition Calculations. Example data in this table originates from work done for the following publication: “Glycosylation of sputum mucins is altered in cystic fibrosis patients”, 2007. Glycobiology , vol. 17 no. 7; pp 698-712

E N D
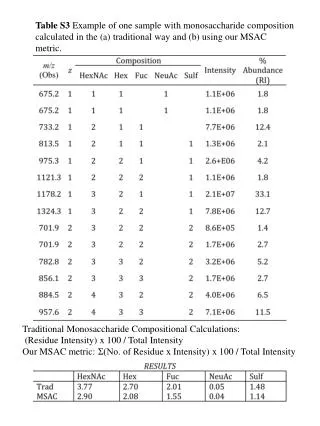
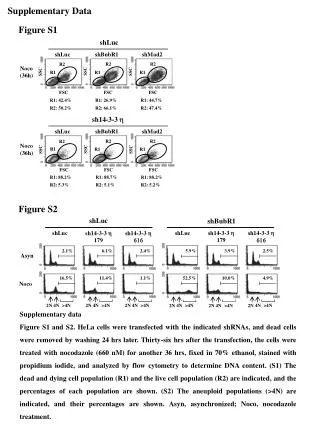
Supplementary Data Average Monosaccharide Composition Calculations • Example data in this table originates from work done for the following publication: “Glycosylation of sputum mucins is altered in cystic fibrosis patients”, 2007. Glycobiology, vol. 17 no. 7; pp 698-712 • The values are from a control sample. • The full composition of the patients glycosylation profile is presented in the Table S1a, and an example calculation for the HexNAc portion of this metric is provided in Table S1b. • One composition is assigned to each mass, but there may be more than one structure for a given composition (e.g. 675.2). • The compositions are weighted using % abundance (relative intensity).
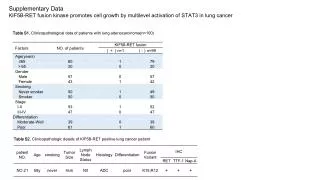
Table 1a Details of Control Patient Glycosylation profile as used to calculate monosaccharide composition metric. m/z, mass to charge ratio; z charge state of the ion; HexNAc, N-acetylhexosamine; Hex, Hexose; Fuc, Fucose; NeuAc, N-acetylneuraminic acid; Sulf, sulfate modification.
Table S1bSample computation of average monosaccharide composition for one sample. (HexNAc residue). The intensities of the structures are converted to percentages. Each instance of the residue is multiplied by the % abundance, the results summed and divided by 100.
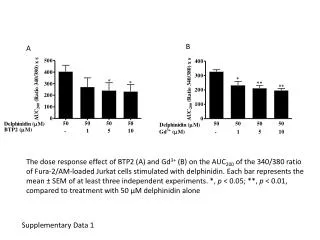
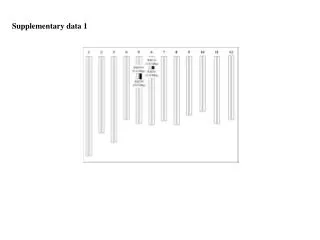
Table S1cStructures of the compositions found in example control patient glycosylation profile (S1a & b). Structures were drawn using GlycoWorkBench (http://www.glycoworkbench.org/) and use the Consortium for Functional Glycomics (CFG) structure nomenclature.