Download
1 / 9
130 likes | 739 Views
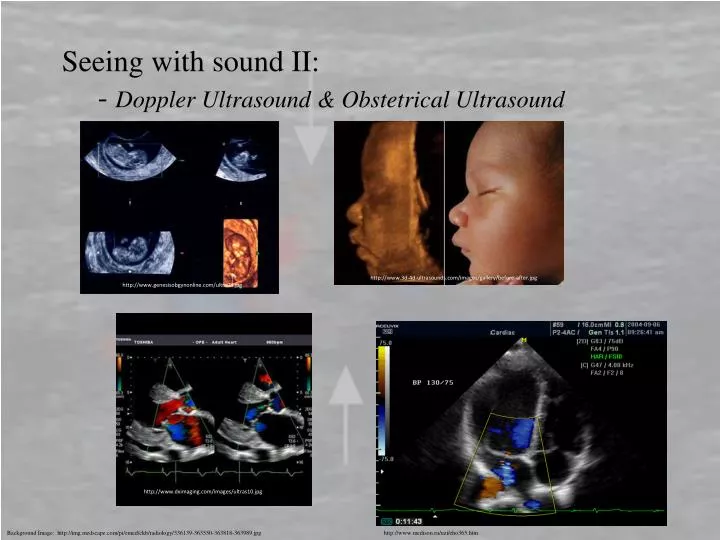
Seeing with sound II: - Doppler Ultrasound & Obstetrical Ultrasound. http://www.genesisobgynonline.com/ultra08.jpg. http://www.3d-4d-ultrasounds.com/images/gallery/before-after.jpg. http://www.medison.ru/uzi/eho365.htm. http://www.dximaging.com/images/ultras10.jpg.

E N D
Seeing with sound II: - Doppler Ultrasound & Obstetrical Ultrasound http://www.genesisobgynonline.com/ultra08.jpg http://www.3d-4d-ultrasounds.com/images/gallery/before-after.jpg http://www.medison.ru/uzi/eho365.htm http://www.dximaging.com/images/ultras10.jpg Background Image: http://img.medscape.com/pi/emed/ckb/radiology/336139-363550-363818-363989.jpg
Diagnostic Doppler Ultrasound • The basis of Doppler ultrasonography is the fact that reflected/scattered ultra-sonic waves from a moving interface will undergo a frequency shift. • The reflections from a stationary object undergo no frequency shift. • In general the magnitude and the direction of this shift will provide information regarding the motion of this interface. • In medicine, Doppler US is used to detect and measure blood flow, and the major reflector is the red blood cell. • The red blood cells act like a moving receiver “hearing” an altered frequency, say f1, which is Doppler shifted from the US beam intensity, f0 resulting in Df1 = f1 – f0. • The red blood cells also act like a moving source when they reflect the US pulse. The reflected frequency is f1 and this is Doppler shifted when it returns to the US transducer and the transducer “hears” a frequency f2 and the result is Df2 = f2 – f1. • The total Doppler shift is the sum of these two frequencies DF = Df2 + Df1 = f2 –f1 . • These frequency shifts, coincidentally, are usually in the audible range.
Diagnostic Doppler Ultrasound • The Doppler shift is dependent on the sound frequency, the velocity of moving blood, and the angle between the sound beam and direction of moving blood, as expressed in the Doppler equation • where Df is the Doppler shift, or the change in frequency between the source and receiver, v is the velocity of the scatters (red blood cells), c is the speed of sound in the medium, and q is the angle between the incident beam and the velocity of the blood cells. • Measuring the Doppler shift in frequency allows for the calculation of blood flow speed. • Doppler US can be performed with US imaging of say the heart, so the physician can orient the transducer to an artery to determine the flow rate with minimal uncertainty. Kane: Physics in Modern Medicine, CRC Press
Diagnostic Doppler Ultrasound • We can solve the Doppler formula for the velocity of the blood. • q is determined by the sonographer by aligning the transducer to the artery or vein. • The maximum Doppler shift is when the transducer points parallel to the flow or antiparallel to the flow. • For q = 90, meaning the meaning that the ultrasound beam is perpendicular to the blood flow, it follows that Df = 0 and there is no Doppler shift, which might lead one to believe that there is no flow. • Also, it is evident that appropriate estimation of the angle q, also called the angle correction, is essential for the accurate determination of Doppler shift and blood flow velocity. • q should also be less than 60° at all times, since the cosine function has a steeper curve above this angle, and errors in angle correction are therefore magnified.
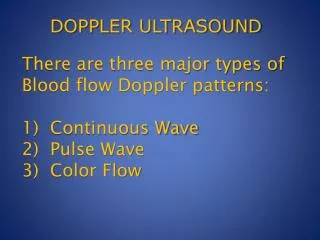
Diagnostic Doppler Ultrasound There are several forms of for the depiction of blood flow in medical Doppler imaging: color, pulsed Doppler, and power Doppler. We’ll look at color Doppler Imaging. Color Flow Images The average Doppler frequency shift of blood flow is depicted in color, and flow direction is arbitrarily assigned, indicated by the blue and red vertical bar at the right of the image. Blue-coded flow is toward the transducer, and red-coded flow is away from the transducer. This technique coupled with echocardiography (which gives distance information) gives a complete picture of the heart and its function. http://ej.rsna.org/ej3/0079-98.fin/mirror_images/fig_12.htm
Echocardiography & Doppler Ultrasound • Echocardiogram, or ultrasound image of the heart. The picture on the right shows an ultrasound image of a normal heart, while the image on the right shows the same structure but with amyloid deposits. • Amyloidosis is a disease characterized by proteins abnormally depositing in various organs in the body. The hallmark of amyloidosis is the specific pattern of deposition – where the proteins deposit as tiny fibrils in a sheet-like fashion. • Amyloid deposits originally impair the heart muscle’s ability to relax, and ultimately impair the heart muscle’s ability to squeeze. • In addition, amyloid deposits can cause abnormalities in the heart’s electrical system, causing the heart rate to be too fast or too slow. • Common signs and symptoms of amyloid cardiac involvement include fluid retention, fatigue, shortness of breath, dizziness, low blood pressure, and fainting. http://stanfordhospital.org/ImageGallery/images/COE/heart/amyloid/echocardiogram.jpg
Echocardiography & Doppler Ultrasound • Video of an echocardiogram with overlaid Doppler ultrasound imaging. • The blue colors represent flow from atria to ventricle (the diastolic portion - the atria receives blood from body by the pulmonary veins and pumps the blood to the ventricles which discharges blood back to the body, - the systolic portion.) • This technique of imaging is also called color flow mapping. http://www.medison.ru/uzi/eho365.htm
Obstetrical Ultrasound - 3D Ultrasound Imaging • 3D ultrasound is a data set that contains a large number of 2D planes (B-mode images). • This is analogous to assuming that a page of a book is one 2D plane, and the book itself is the entire data set. • Once the Volume is acquired using a dedicated 3D probe you can “Walk” through the volume in a manner similar to leafing through the pages of a book, meaning you can walk through the various 2D planes that make up the entire volume. • This is also known as translation and the planes are reconstructed using a computer. http://www.3d-4d-ultrasounds.com/images/gallery/before-after.jpg http://www.doctorscareclinic.com/html/ultrasound.html
Obstetrical Ultrasound - 3D Ultrasound Imaging • Each US image represents one slice of the body and by taking therefore multiple cross sectional scans and putting them “side-by-side” you can render a 3D image or you could view any one of the 2D slices. • The transducer has to “fan out” across a section of body and sweep out a volume of space to be sliced and the physician/ ultrasonographer can select particular intensity echoes to display. You can “select out” the heart or fetus. • 4D ultrasound is also known as "Real-time 3D Ultrasound" – The basic concept being that the processing powers of the computers has increased so much that today we can get our ultrasound equipment to acquire and display the 3D datasets with their multi-planar renderings in real time, as we scan the patient. • This has many benefits in obstetrical scanning where it is critical to analyze anatomy as it continues its physiological movements. http://www.gehealthcare.com/usen/ultrasound/education/images/u3d4d/fig1.jpg KANE PG 139