Download
1 / 26
270 likes | 420 Views
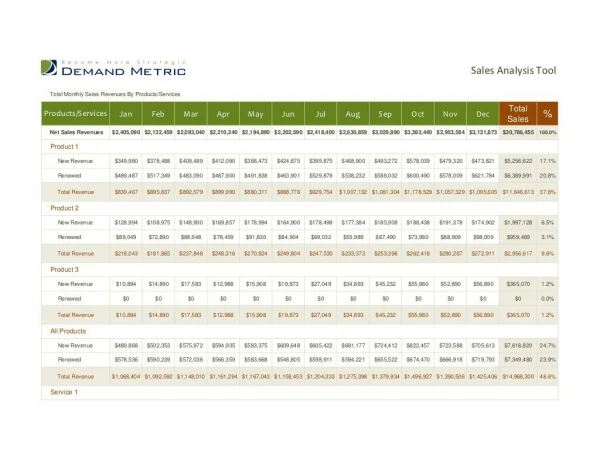
Added Value Analysis TOOL USED IN SALES AND MARKETING PRODUCTIVITY PROJECTS. The Composition Of The Presentation. INTRODUCTION. CHECKLIST. EXAMPLES. SOFTWARE. What is Added Value Analysis? Who is involved? Why is AVA effective? How is it performed?. Overview.

E N D
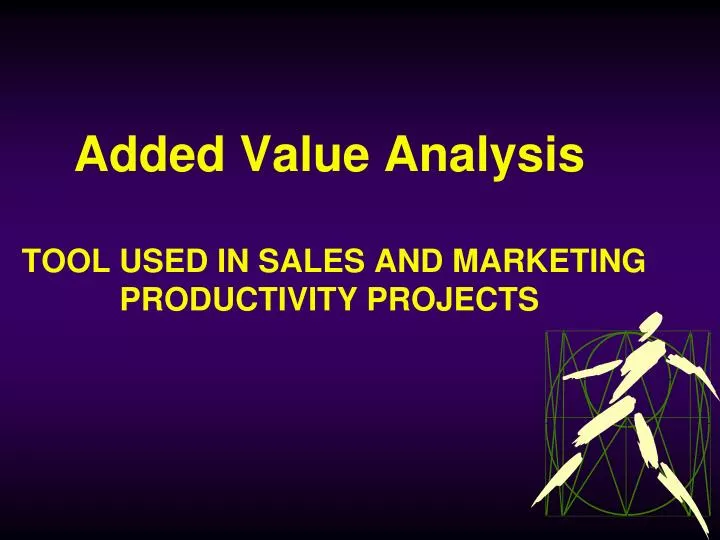
Added Value Analysis TOOL USED IN SALES AND MARKETING PRODUCTIVITY PROJECTS
The Composition Of The Presentation INTRODUCTION CHECKLIST EXAMPLES SOFTWARE
What is Added Value Analysis? Who is involved? Why is AVA effective? How is it performed? Overview
An Added Value Analysis (AVA) is a systematic observation with the aim of: focusing everyone's energy on essential activities improving effectiveness of all activities by streamlining decision making and improving accountability achieving lasting improvements by eliminating non-essential tasks building commitment to ongoing improvement by involving staff in the process What is an AVA?
The AVA study is not: An attempt to get people to work harder A way of getting the same workload done with fewer people An attempt to reduce the quality of the work to the detriment of the business What an AVA is NOT ...
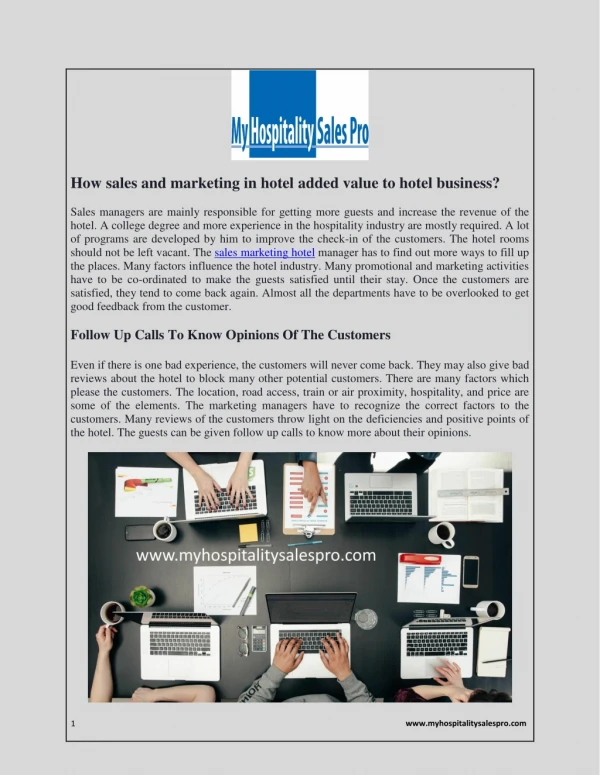
All relevant Marketing, Sales and Supply Chain functions, i.e. Marketing manager Product / Brand manager Key Account Manager (KAM) Supply chain managers Any type of supporting function related to Marketing and Sales Who is involved?
Why is an AVA effective? • The participants generate the improvement idea in conjunction with the team • It involves all areas in innovative thinking and idea analysis • The management approval process ensures a fit with long term strategy • It improves managers' cost awareness of the tasks performed • It streamlines activities, tailoring the organisation to its workload
Why carry out this survey? Do we know which activities we spend our time on? (This Survey) 30% Knowledge ? 100% Knowledge (Prior to Survey) (A full Time & Motion study) Better Decisions can be made
The Composition Of The Presentation INTRODUCTION CHECKLIST EXAMPLES SOFTWARE
Preparation with the unit heads Analysis of activities Idea generation Action plan How is it performed?Overview in 4 steps
- Meet with the Unit / Department Heads - Explain how the study is carried out - Explain the role of the organization and the expected benefits - Explain timetable and key dates - Show examples of results from previous projects - Show example of documents to be used (ie: AVA form) STEP 1 Preparation with the unit heads
Preparation phase - Define the areas of the Company to analyse and the names of people that are going to receive the AVA - Define the AVA form(s), adapted for the market - Make the computer ready to input the data once the AVAs are received - Prepare a cover letter and a sheet with instructions on how to fill out the AVA Analysis of activities STEP 2
AVA collection phase - Send in a close envelope AVAs to participants - Once AVAs are received verify their correctness - contact authors to solve compilation errors, if any Analysis of activities STEP 2 AVA collection phase (2nd option) - Gather participants in group sessions - Explain the AVA during the meeting - Ask them to compile the AVA during the same meeting
Process AVAs with the computer application - Input AVAs as soon as they are received and validated - Extract reports from the system to analyse results Analysis of activities STEP 2
Perform Brainstorming sessions to: - Analyse results of AVA - Generate ideas to improve productivity and eliminate activities with no value added - Evaluate cost, benefits, and feasibility of ideas proposed - Integrate ideas with other proposals coming from the project STEP 3 Idea generation Present ideas to management to obtain approval
- Define timetable for implementation considering also pilot initiatives - Define resources needed - Start implementation Action Plan STEP 4
Don't underestimate the time needed Test the forms before sending them out by someone from the local Market Inform people that no names will be disclosed and that results will be analysed in aggregated form Tips ...
The Composition Of The Presentation INTRODUCTION CHECKLIST EXAMPLES SOFTWARE
100 OTHERS 8.6 15 CONSUMER 80 RELATED ACTIVITIES 14.5 NPD 60 8.7 STRATEGY 11 SALES 40 7 SUPPLY 7.2 CHAIN 20 MARKETVISITS 28 MEETINGS 0 Market X: Breakdown of main Brand Management activities • A third of brand management's time is spent in meetings (28%) and market visits (7%) • Of the remaining 65%, consumer related activities, new products and sales are the three key activities of Brand Management
100 8.6 15 80 14.5 60 8.7 11 COMMUNI- CATION 40 7 3.2% PROMO- PR & TIONS 7.2 SPONSOR- 4.2% SHIP 1.3% 20 28 AGENCY- 0 MEETINGS 6.3% Market X: Consumer related activities • Involves major activities of planning and implementing communication programs and promotions • Brand Management spends only 15% of total time on this - hence time spent on each task is low
New product development involves 14.5% of brand management time However time spent on each specific activity is low Market X:New product development 100 8.6 15 80 14.5 60 MKT ANALYSIS 8.7 RESEARCH 1.7% 0.9% LAUNCH 11 FOLLOW-UP PLANNING & 1.9% 40 7 COORD. 6.5% 7.2 INT. LAUNCH 1.9% 20 28 LAUNCH PREPA- 0 RATION TASTING 0.9% 0.7%
The Composition Of The Presentation INTRODUCTION CHECKLIST EXAMPLES SOFTWARE
Added Value Analysis TOOL USED IN SALES AND MARKETING PRODUCTIVITY PROJECTS