Download
1 / 34
340 likes | 452 Views
Discrete Probability Distributions. 4. x = number of on time arrivals. x = number of correct answers. Elementary Statistics Larson Farber. x = number of employees reaching sales quota. x = number of points scored in a game. Definitions. probability distribution

E N D
Discrete Probability Distributions 4 x = number of on time arrivals x = number of correct answers Elementary Statistics Larson Farber x = number of employees reaching sales quota x = number of points scored in a game
Definitions • probability distribution • discrete probability distribution (Chapter 4) • continuous probability distribution (Chapter 5 +) • random variable • discrete random variable • continuous random variable • mean of a probability distribution
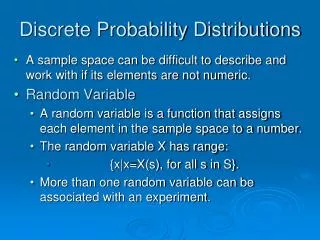
Random Variables A random variable, x is the numerical outcome of a probability experiment. • x = The number of people in a car • x = The gallons of gas bought in a week • x = The time it takes to drive from home to school • x = The number of trips to school you make per week
Types of Random Variables A random variable is discrete if the number of possible outcomes is finite or countable. Discrete random variables are determined by a count. A random variable is continuous if it can take on any value within an interval. The possible outcomes cannot be listed. Continuous random variables are determined by a measure.
Types of Random Variables • X = Number of sales calls a salesperson makes in one dayP(x>10)x = Hours spent on sales calls in one day. • P(X >6.5)
Discrete or Continuous? A random variable, x is the numerical outcome of a probability experiment. • x = The number of people in a car • x = The gallons of gas bought in a week • x = The time it takes to drive from home to school • x = The number of trips to school you make per week
Types of Random Variables Identify each random variable as discrete or continuous. • x = The number of people in a car • x = The gallons of gas bought in a week • x = The time it takes to drive from home to school • x = The number of trips to school you make per week Discrete – you count the number of people in a car 0, 1, 2, 3… Possible values can be listed. Continuous – you measure the gallons of gas. You cannot list the possible values. Continuous – you measure the amount of time. The possible values cannot be listed. Discrete – you count the number of trips you make. The possible numbers can be listed.
Discrete Probability Distributions A discrete probability distribution lists each possible value of the random variable, together with its probability. A survey asks a sample of families how many vehicles each owns. number of vehicles • Properties of a probability distribution • Each probability must be between 0 and 1, inclusive. • The sum of all probabilities is 1.
Probability Histogram 0 . 4 3 5 . 4 0 0 . 3 5 5 . 3 0 0 . 2 0 6 0 . 0 0 4 N u m b e r o f V e h i c l e s P(x) . 2 0 . 1 0 0 0 1 2 3 x 0 1 2 3 • The height of each bar corresponds to the probability of x. • When the width of the bar is 1, the area of each bar corresponds to the probability the value of x will occur.
Constructing a Discrete Probability Distribution • Make a frequency distribution for the possible outcomes. • Find the sum of the frequencies. • Find the probability of each possible outcome by dividing its frequency by the sum of the frequencies. • Check that each probability is between 0 and 1 and that the sum is 1.
Discrete Probability Distributions • Make a frequency distribution for the possible outcomes. • Find the sum of the frequencies. • Find the probability of each possible outcome by dividing its frequency by the sum of the frequencies. • Check that each probability is between 0 and 1 and that the sum is 1.
Mean, Variance and Standard Deviation The mean of a discrete probability distribution is: The variance of a discrete probability distribution is: The standard deviation of a discrete probability distribution is:
Mean (Expected Value) Calculate the mean Multiply each value by its probability. Add the products The expected value (the mean) is 1.763 vehicles.
Calculate the Variance and Standard Deviation The mean is 1.763 vehicles. μ μ P(x) variance The standard deviation is 0.775 vehicles.
Expected Value Expected value of a discrete random variable • Equal to the mean of the random variable. • E(x) = μ = ΣxP(x) Interpretation: We would EXPECT each household in this population to own 1.8 cars (std dev = .775 cars)
Section 4.2 Binomial Distributions
Guess the Answers 1. What is the 11th digit after the decimal point for the irrational number e? (a) 2 (b) 7 (c) 4 (d) 5 2. What was the Dow Jones Average on February 27, 1993? (a) 3265 (b) 3174 (c) 3285 (d) 3327 3. How many students from Sri Lanka studied at U.S. universities from 1990-91? (a) 2320 (b) 2350 (c) 2360 (d) 2240 4. How many kidney transplants were performed in 1991? (a) 2946 (b) 8972 (c) 9943 (d) 7341 5. How many words are in the American Heritage Dictionary? (a) 60,000 (b) 80,000 (c) 75,000 (d) 83,000
Quiz Results The correct answers to the quiz are: 1. d 2. a 3. b 4. c 5. b Count the number of correct answers. Let the number of correct answers = x. Why is this a binomial experiment? What are the values of n, p and q? What are the possible values for x?
Binomial Experiments 4 Characteristics of a Binomial Experiment • There are a fixed number of trials. • The trials are independent and repeated under identical conditions. • Each trial has 2 outcomes • There is a fixed probability of success on a single trial. The random variable x is a count of the number of successes in n trials.
Binomial Experiments Characteristics of a Binomial Experiment • There are a fixed number of trials. (n) • The n trials are independent and repeated under identical conditions. • Each trial has 2 outcomes, S = Success or F = Failure. • The probability of success on a single trial is p. P(S) = p • The probability of failure is q. P(F) =qwherep + q = 1 • The central problem is to find the probability of xsuccesses out of n trials. Where x = 0 or 1 or 2 … n. The random variable x is a count of the number of successes in n trials.
Binomial Experiments A multiple choice test has 8 questions each of which has 3 choices, one of which is correct. You want to know the probability that you guess exactly 5 questions correctly. Find n, p, q, and x. A doctor tells you that 80% of the time a certain type of surgery is successful. If this surgery is performed 7 times, find the probability exactly 6 surgeries will be successful. Find n, p, q, and x.
Binomial Experiments A multiple choice test has 8 questions each of which has 3 choices, one of which is correct. You want to know the probability that you guess exactly 5 questions correctly. Find n, p, q, and x. n = 8 p = 1/3 q = 2/3 x = 5 A doctor tells you that 80% of the time a certain type of surgery is successful. If this surgery is performed 7 times, find the probability exactly 6 surgeries will be successful. Find n, p, q, and x. q = 0.20 n = 7 p = 0.80 x = 6
Binomial Probabilities Find the probability of getting exactly 3 questions correct on the quiz. Write the first 3 correct and the last 2 wrong as SSSFF P(SSSFF) = (.25)(.25)(.25)(.75)(.75) = (.25)3(.75)2 = 0.00879 Since order does not matter, you could get any combination of three correct out of five questions. List these combinations. SSSFF SSFSF SSFFS SFFSS SFSFS FFSSS FSFSS FSSFS SFSSF FFSSF Each of these 10 ways has a probability of 0.00879. P(x = 3) = 10(0.25)3(0.75)2 = 10(0.00879) = 0.0879
Combination of n values, choosing x There are ways. Find the probability of getting exactly 3 questions correct on the quiz. Each of these 10 ways has a probability of 0.00879. P(x = 3) = 10(0.25)3(0.75)2= 10(0.00879)= 0.0879
Binomial Probabilities In a binomial experiment, the probability of exactly x successes in n trials is Use the formula to calculate the probability of getting none correct, exactly one, two, three, four correct or all 5 correct on the quiz. P(3) = 0.088 P(4) = 0.015 P(5) = 0.001
Binomial Distribution x P(x) 0 0.237 1 0.396 2 0.264 3 0.088 4 0.015 5 0.001 P(3) = 0.088 P(4) = 0.015 P(5) = 0.001
Binomial Distribution . 3 9 6 . 2 9 4 . 2 3 7 . 0 8 8 . 0 1 5 0 0 1 x P(x) 0 0.237 1 0.396 2 0.264 3 0.088 4 0.015 5 0.001 Binomial Histogram . 4 0 . 3 0 . 2 0 . 1 0 . 0 0 1 2 3 4 5 x
Probabilities x P(x) 0 0.237 1 0.396 2 0.264 3 0.088 4 0.015 5 0.001 1. What is the probability of answering either 2 or 4 questions correctly? 2. What is the probability of answering at least 3 questions correctly? 3. What is the probability of answering at least one question correctly?
Probabilities x P(x) 0 0.237 1 0.396 2 0.264 3 0.088 4 0.015 5 0.001 1. What is the probability of answering either 2 or 4 questions correctly? 2. What is the probability of answering at least 3 questions correctly? 3. What is the probability of answering at least one question correctly? P( x = 2 or x = 4) = 0.264 + 0.015 = 0. 279 P(x 3) = P( x = 3 or x = 4 or x = 5) = 0.088 + 0.015 + 0.001 = 0.104 P(x 1) = 1 - P(x = 0) = 1 - 0.237 = 0.763
Parameters for a Binomial Experiment Mean: Variance: Standard deviation: Use the binomial formulas to find the mean, variance and standard deviation for the distribution of correct answers on the quiz.