Download
1 / 48
480 likes | 638 Views
CHAPTER 2: YOUR FINANCIAL STATEMENTS AND PLANS. Mapping Out Your Financial Future. Financial planning facilitates: Greater wealth Financial security Attainment of financial goals. Financial plans, budgets and statements facilitate financial planning!.

E N D
Mapping Out Your Financial Future Financial planning facilitates: • Greater wealth • Financial security • Attainment of financial goals
Financial plans, budgets and statements facilitate financial planning! • Link future goals and plans with actual results • Provide direction, control and feedback
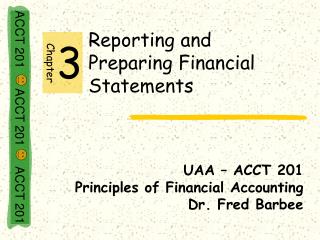
* evaluate and plan major outlays * reduce taxes * establish savings and investment programs * manage credit * secure adequate insurance * implement retirement program * facilitate estate distribution FINANCIAL PLANS The Interlocking Network of Financial Plans & Statements
* evaluate and plan major outlays * reduce taxes * establish savings and investment programs * manage credit * secure adequate insurance * implement retirement program * facilitate estate distribution feedback FINANCIAL PLANS feedback * monitor and control income, living expenses, purchases, and savings on a monthly basis BUDGETS FINANCIAL STATE- MENTS Actual financial results * balance sheet * income & expenditures statement
Special Planning Concerns: 1. Dual income families 2. Employee benefit choices 3. Major life changes, such as: • First job • Marriage • Children • Death of family member • Divorce • Change in health • Loss of job • Change in economy
Types of Financial Planners: • Commissioned salespeople who work for financial institutions. • Fee-only financial planners who work for the individual client. • Planners who charge both fees and commissions, depending on the products and services offered. • Computerized financial plans prepared by financial institutions.
Financial Planning Designations • Certified Financial Planner (CFP): Requires a comprehensive education in financial planning • Chartered Financial Consultant (ChFC): Financial planning designation for insurance agents • Certified Trust & Financial Advisor (CTFA): Estate planning and trusts expertise, found mostly in the banking industry • Personal Financial Specialist (PFS): Comprehensive planning credential only for CPAs • Chartered Life Underwriter (CLU): Insurance agent designation, often accompanied by the ChFC credential
Choosing A Financial Planner • Largely unregulated industry (be careful with the self-claimed financial planners) • Tips on choosing a financial planner: • Know what you want • Talk to others (get referrals) • Interview several planners • Check the planner’s background • Get it in writing • Receive regular statements • Reassess the relationship regularly
Time Value of Money:Putting a Dollar Valueon Financial Goals A dollar today is worth more than a dollar received in the future because it can be invested and earn interest.
Types of TVM Calculations: • Single sum—one lump sum investment with no more additions or subtractions. • Annuity—a series of equal payments made at fixed time intervals for a specified number of periods.
Ways to Calculate TVM: • Formulas • Tables (see Appendices A-D) • Financial calculators • Spreadsheets (ex: Excel) • Internet calculators (search on “calculators”)
Future Value • The value your invested money will grow to become earning a specific rate of interest over a given time period. • The process of growing today’s present value to a larger future value by applying compound interest is known as “compounding.”
Calculating theFuture Value of a Single Sum: Example: What will $5000 grow to become if invested at 10% for 6 years? Tables (Find Future Value Factor for 6 years and 10% in Appendix A) FV = PV x Factor $5000 x 1.772 = $8,860 Calculator (Set on 1 P/YR and END mode.) 5000 +/- PV 6 N 10 I/YR FV $8,857.81
Calculating theFuture Value of an Annuity: Example:What would you accumulate if you could invest $5000 every year for the next 6 years at 10%? Tables (Find Future Value Annuity Factor for 6 years and 10% in Appendix B) FV = PMT x Factor $5000 x 7.716 = $38,580 Calculator (Set on 1 P/YR and END mode.) 5000 +/- PMT 6 N 10 I/YR FV $38,578.05
Present Value • The amount needed today to invest at a specific rate of interest over a given time period to accumulate the desired future amount. • “Discounting” is the reverse of compounding and is the process of working from the future value back to the present value.
Calculating thePresent Value of a Single Sum Example: You wish to accumulate a retirement fund of $300,000 in 25 years. If you can invest at 7%, what single lump-sum deposit must you make today in order to achieve your goal?
Tables (Find Present Value Factor for 25 years and 7% in Appendix C) PV = FV x Factor $300,000 x .184 = $55,200 Calculator (Set on 1 P/YR and END mode.) 300000 +/- FV 25 N 7 I/YR PV $55,274.75
Calculating thePresent Value of an Annuity Example: Your rich uncle wishes to give you a sum of money today to use for the next 4 years of college. If you need $10,000 a year and will leave the remainder invested at 7%, how much should you tell him you need?
Tables (Find Present Value Annuity Factor for 4 years and 7% in Appendix D.) PV = PMT x Factor $10,000 x 3.387 = $33,870 Calculator (Set on 1 P/YR and END mode.) 10000 +/- PMT 4 N 7 I/YR PV $33,872.11
Balance Sheet A statement of your financial position at one point in time.
Balance Sheet Equation: Liabilities Assets = + Net Worth
Balance Sheet ASSETS LIABILITIES (Payoff Amount of Loans and Debts) NET WORTH (Your Equity Portion) (Fair Market Value of Assets)
Balance Sheet ASSETS LIABILITIES • What you own: • checking acct. • car • investments • jewelry • furniture • What you owe: • car loan • credit card balances • education loans • unpaid monthly bills • NET WORTH • (Subtract total liabilities • from total assets to • determine net worth.)
The Concept of Solvency: • If your net worth is POSITIVE, you are SOLVENT and have enough assets to cover your financial obligations. • If your net worth is (NEGATIVE), you are INSOLVENT and do not have enough assets to cover your financial obligations.
The Income and Expense Statement A measure of your financial performance over a given time period.
Income and Expense Statement: Total Income – Total Expenses = CASH SURPLUSOR (CASH DEFICIT)
Income: Cash IN • Wages and salaries • Bonuses • Interest and dividends • Child support • Tax refunds • Gifts
Expenses: Cash OUT • FIXED Rent or mortgage payment Cable TV Insurance • VARIABLE Dry cleaning Recreation Eating out
CASH SURPLUS (DEFICIT): • If your income exceeds your expenses, you have a CASH SURPLUS. • If your expenses exceed your income, you have a (CASH DEFICIT).
Using Your Personal Financial Statements • Maintain a good recordkeeping system • Prepare financial statements periodically • Track financial progress
Ratio Analysis Financial ratios allow you to: • Track progress toward your financial goals • Evaluate your financial performance over a period of time
Balance Sheet Ratios Solvency Ratio • Shows the state of your net worth at a given point in time. • Indicates your potential to withstand financial problems. Total net worth Total assets
Example: $41,420 $147,175 = .28 or 28% The larger this ratio, the greater the financial cushion to protect against insolvency. This family could withstand a 28% decline in asset value before they would be insolvent.
Liquidity Ratio • Measures your ability to pay current debts with existing liquid assets. • Current is defined as needing payment within one year. Liquid assets Total current debts
Example: $2,225 $22,589 = .099 or 9.9% The higher this ratio, the longer the existing liquid assets can cover the yearly living expenses. This family could last about 1.2 months or 1/10th of a year on their existing liquid assets.
Income & Expense Statement Ratios Savings Ratio • Shows the percentage of after-tax income being saved during a given period. Cash surplus Income after taxes
Example: $11,336 ($73,040 – $15,430) = 0.197 or 19.7% The higher this ratio, the greater the amount of after-tax income being saved. This family is doing much better than the national average of 5–8%.
Debt Service Ratio • Indicates ability to repay loan obligations promptly with before-tax income. Total monthly loan payments Monthly gross income
Example: $1,807 $6,807 = .266 or 26.6% The lower this ratio, the less the difficulty in making monthly loan payments. This family’s ratio is under 35% and would probably be considered at a manageable level.
Preparing & Using Budgets Budget • A short-term financial planning report that helps you achieve your short-term financial goals. • Achieving your short-term goals then helps you achieve your longer-term goals.
Budgets help you: • Monitor and control finances. • Allocate income to reach goals. • Implement system of disciplined spending. • Reduce needless spending. • Achieve long-term financial goals.
The Budgeting Process • Estimate income • Estimate expenses • Finalize the cash budget • Deal with deficits
What should you do if you have monthly deficits? • Shift expenses from months with deficits to months with surpluses. • Use savings, investments, or borrowing to cover temporary deficits.
What should you do if you end the year in a deficit? • Liquidate savings/investments • Borrow to cover the deficit • Cut low priority expenses; alter spending habits • Increase income
Deficit spending causes you to Deficit spendingDECREASESyour Net Worth! Deplete an existing asset, Incur more debt – Or both!
Things to remember about a budget: • Use a Budget Control Schedule to compare your budgeted figures to your actual figures and determine the variances. • Continually update your budget based upon the actual figures. • Always try to keep your budget balanced or, even better, at a surplus.