Download
1 / 43
430 likes | 578 Views
Reliable Estimation of Execution Time of Embedded SW: A Statistical Approach. Grant Martin, Paolo Giusto and Ed Harcourt Front End Products: System Level Design and Verification 26 October 2000. Agenda. Motivation for SW estimation in HW-SW codesign Context Various estimation techniques

E N D
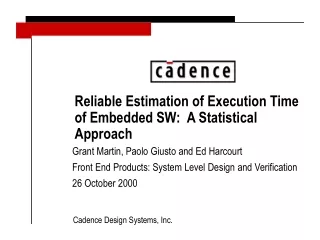
Reliable Estimation of Execution Time of Embedded SW: A Statistical Approach Grant Martin, Paolo Giusto and Ed Harcourt Front End Products: System Level Design and Verification 26 October 2000
Agenda • Motivation for SW estimation in HW-SW codesign • Context • Various estimation techniques • The Statistical approach • Preliminary results • Ideas for the future
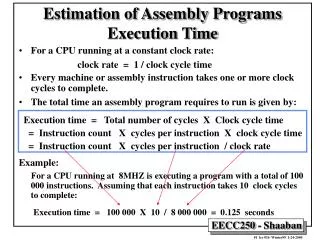
1 2 System Function System Architecture Processor Software Needed to make HW-SW tradeoffs and to estimate ‘fit’ of SW to Processor(s) Mapping Functional Simulation 3 Performance Simulation Estimate of Execution Time Communication Refinement 4 Flow To Implementation Function-Architecture Co-Design, as in Cadence VCC Motivation • Improve Quality of Estimators • Provide Quality-Speed Options
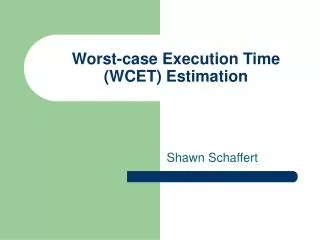
Virtual Machine Instructions v__st_tmp = v__st; startup(proc); if (events[proc][0] & 1) goto L16; Analyse basic blocks compute delays ANSI C Input ld ld op ld li op ts -- br ΠSpecify behavior and I/O Generate new C with delay annotations Compile generated C and run natively v__st_tmp = v__st; __DELAY(LI+LI+LI+LI+LI+LI+OPc); startup(proc); if (events[proc][0] & 1) { __DELAY(OPi+LD+LI+OPc+LD+OPi+OPi+IF); goto L16; } Architecture Characterization Performance Estimation Virtual Processor Model Estimation Evolution of approaches used in POLIS
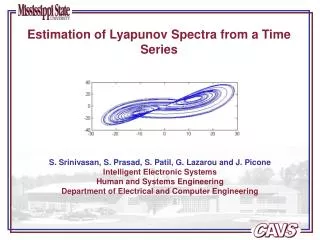
Virtual Processor Model Example XXX Virtual Instruction Set Model (Basis file) LD,3 Load LI,1 Load Immdiate. ST,3 Store OP.c,3 Simple ALU Operation OP.s,3 OP.i,4 OP.l,4 OP.f,4 OP.d,6 MUL.c,9 Complex ALU Operation MUL.s,10 MUL.i,18 MUL.l,22 MUL.f,45 MUL.d,55 DIV.c,19 DIV.s,110 DIV.i,118 DIV.l,122 DIV.f,145 DIV.d,155 IF,5 Test and Branch GOTO,2 Unconditional Branch SUB,19 Branch to Subroutine RET,21 Return from Subroutine Basis file derived from DataBook • Register Allocation Technique • None, LocalScalarsOnly, LocalScalarsAndParameter, ParameterOnly
Problems with VPM approach • Cannot incorporate Target-dependent compiler optimisations • Special HW, register set (accurately) • Does not model processor state • Pipelines, register occupancy • Very Unclear how to handle Superscalar, VLIW, etc. • Improvements to model target HW and compilers slow it down • Can add ‘statistical’ fudge factors - hard to characterise • ‘Field of Use’ vs. ‘Field of Abuse’ hard to characterise • Most suitable for Control-dominated code, not computation-dominated (compiler optimisations and special HW effects) • Databook approach VERY conservative….worst-case assumptions • What is the confidence level for the estimation?
Target.c Target.s Other.o Host.c Host.o Libraries Host.exe Other.s Options Target CC Host CC Host Linker CC-ISS Compiled Code ISS One approach to a Compiled Code ISS translates Target assembler code into portable C code that when executed on the Host will reasonably accurately emulate the Timing, Functionality and Memory transaction behavior of the Target Architecture for the specific program --Target.c
Problems with Compiled Code-ISS • Modeling! • Generation of Compiled code ISS models and tooling often very time-consuming • many person-months to person-years • Slower than VPM approach • Modeling of internal processor state, HW resources etc. comes at a cost • May be 2-5X slower (various approaches available) • Some modelling compromises made to achieve speed • Interpretive ISS approach can be more accurate • BUT different levels of accuracy can be achieved at slower speed • Areas not proven well: modeling parallel resources and HW scheduling
Interpretive ISS • Execute Code stream in interpretive fashion on model of processor • usually C/C++ based model • models processor state and all internal resources • can interact with memory and bus models to achieve high accuracy • Models very often produced by IP providers or 3rd parties • usually available either before IP or with IP introduction
Problems with Interpretive ISS • Very slow - at least one order of magnitude slower than Compiled Code ISS and 2 orders (100X) slower than VPM approach • Simulates instruction Fetch, Decode and Dispatch dynamically at runtime. • Models internal processor resources and state • Can be used to validate other approaches for accuracy and understand ‘field of use’ • But unlikely to be useful for significant dynamic execution of embedded SW
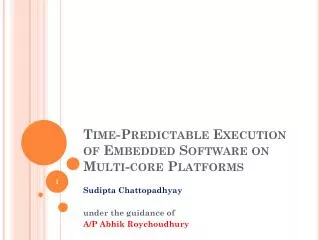
AFIR B* DFFT 1 1 1 1 16 1 1 CTONE Mathematical Kernel Functions (e.g. Dataflow) SPW/Cossap/Ptolemy Modeling Schedule (16 A C B) D AT&T DSP16xx Intel Pentium MMX Motorola 56kFIR(t) = 14 + 4(t - 1) TONE() = 52 MULT() = 4FFT(p) = 122 + 32p VECTSUM(n) = 5 + 2 * n Cost16 • FIR(128) + 16 • TONE + 16 • MULT + FFT(256)
Problems with Mathematical Kernels • Not at all suitable for data-dependent Control code • Best for fixed processing of fixed sample sizes • Has been used for characterising DSP’s • e.g. BDTI - Berkeley Design Technology • FFT on a Motorola 56k of p points has a latency of 122 + 32p cycles • FIR filter on a Motorola 56k has a latency of 14 + 4(t - 1) cycles. • Effective modelling depends on large families of pre-characterised kernels • finding right balance of accuracy and granularity a problem • Needs in-depth application-specific knowledge to apply • Cannot be easily automated
Manual Back-annotation approach • Measure generated code on target processor with target compiler • Compilation optimisations handled • Target dependent HW handled • Can use accurate Cycle-counting Instruction Set Simulator or real HW • could also use emulation systems • Back-annotate source code for use in co-design estimation • Delay models applicable to whole task (black box approach) • Annotate basic blocks of task with measured numbers • Possible to combine measured and kernel function approaches
Problems with Manual Back-annotation • Extensive characterisation effort required • Works best on computation-intensive code • Data-dependent control code hard to characterise or tedious to annotate every block • Requires either real HW (very late in process) or accurate ISS • accurate ISS may depend on detailed RTL-level design • not suitable for early speculation on processor features • Manual! • Not easy to automate
Can we improve VPM? • The Data Book Approach to VPM estimators is very conservative • e.g. for processor XXX, LD = 3 cycles but compilers can optimise down to something a little over 1 on average • SUB and RET with 15 user registers: • conservative estimate of 19 and 21 cycles (4+Active Reg, 6+AR) • actual usage is more like 5-10 active registers (statistically) • The Data book approach, or any kind of artificial ‘Calibration Suite’, is applied to all kinds of embedded SW • But embedded SW is not all the same • control vs. computation • application specific features e.g. wireless, wired comms, automotive, multimedia image processing
Abandon Causality, Embrace Correlations • VPM approach based on Databook cycle counts assumes a causal relationship between the presence of a Virtual instruction in the ‘fuzzy’ compililation, and some (fixed) number of cycles in the task cycle count, if the Virtual instruction lies in an executed basic block. • Conservative assumptions on cycle counts • No application domain specific characteristics • Cannot account for target compiler optimisations • A statistical approach abandons the idea of causal relationships • Rather, it seeks to find correlations between characteristics of the source code and the overall cycle count, and use them to build better predictor equations
Source Code characteristics • Need dynamic characteristics, not static ones • Obvious source: Virtual instructions from the VPM model! • But rather than assume that each instruction ‘attracts’ a fixed number of cycles in the task cycle count, seek correlations between virtual instruction frequencies and overall cycle count. • Statistical technique used: • Stepwise multiple linear regression • Virtual instruction counts are not really all independent variables; use correlations between them to reduce the number of variables used in the predictor equation • Note that this can subsume compiler effects to some extent
Statistical Benchmarking approach • Identify a benchmark set of tasks: sample set • Application domain specific • Run the tasks through the VPM instruction frequency counting • Run the tasks on a cycle-accurate ISS or HW • Reduce the VPM instructions to a set of independent variables • using correlation analysis • Run a stepwise and normal multiple linear regression on the sample • Produce a predictor equation with quality metrics • Apply it to new code • drawn from the same application domain (should do reasonably) • Other domains (may do poorly) • Determine a discriminating function that can be used to test code to see if it is from the same domain as the sample set
Stepwise Multiple Linear Regression • Regression: Y = B + Si Ci * Xi • where Y = Dependent variable (to be predicted) • B = intercept • i e I where I = the set of orthogonal (independent) Virtual Instructions (independent variables) • Ci = the coefficient for • Xi = the cycle count for Virtual Instruction I • Stepwise - Independent variables are added one at a time • Must pass a test of statistical significance • When no more variables can be added, regression stops • Sample size should be larger than the number of independent variables, else regression is over-determined.
= one sample Y B X Regression • Simple linear regression: Y = B + mX • Minimise Sum of Squared Errors = S (Ysamplei-Ypredictedi)2 • Measure ‘quality’ of Predictor Equation via R2 = the square of the correlation coefficient • R2 is defined as “the proportion of the variation of Y that is explained (accounted for) by the variation in the X’s”.
Note on R2 • R2 does not imply causality • Rather, it can be used to gauge the ‘quality’ of the resulting predictor equation • R2 of 1.00 means a ‘perfect’ predictor equation is possible • Want R2 as high as possible, but respectable results can be obtained with low R2 • Correlation between a set of independent variables and a dependent variable is a study in variability, not causality • Our hypothesis is that the resulting predictor can be used on new samples (code) drawn from the same population (application domain)
First Study: Set of 35 ‘Automotive’ benchmarks • Control dominated; not much computation • Divided into Sample Set of 18, Control set of 17 randomly • Partial excerpt of virtual instruction counts:
Independent variable selection • In this sample set, Muli and Divi were constant over the samples • No variability implies nothing to contribute to Cycle variability, so drop • SUB and RET were perfectly correlated (no surprise!) • LD, OPi and IF highly correlated (over 90%) • Only need one of them. • Therefore, regression run with: • LD, LI, ST, GOTO and SUB • 5 independent variables, with sample size of 18
Regression Results and Interpretation • R2 = 0.57 • Cycles = 219 + 1.3*LD + 10.9*LI - 10.2*ST - 5.2*GOTO - 21.3*SUB • Note: This is a pure “Predictor Equation” • Intercept does not have to make ‘sense’ • Coefficients have NO operative meaning • Positive and negative correlations can’t be ‘interpreted’ • Task cycle counts ranged from 151 to 246. Many of them less than the intercept of 219! • When predictor applied to Control group of 17, error -16% to +3% • When predictor back-applied to sample set, error -8% to +13% • Data sheet model applied to all 35, error -10% to +45% (conserv.)
Stepwise results • Running it only adds LD to equation with an R2 of .500 (in other words, LD variability explains far more of the cycle count variability than any of the other variables. • Predictor equation: • Cycles = 146 + 3.6*LD • Note - when applied to the control set of 17 we get error of -16% to +8% (24% range) • when back applied to sample set of 18, we get error of -8% to +14% (22% range) • Equation is very robust. Since LD’s are present in all programs, unusual instructions (e.g. Muld’s, etc.) do not skew the results. However, would do very poorly on mathematical code
Larger Sample Set • We took the 35 ‘automotive’ control samples, added 6 ‘Esterel’ examples (believed control dominated), and 4 other ‘control’ oriented pieces of code, for a sample of 45 benchmarks. • Multiple regression was applied, and then we manipulated the set of independent variables (through ‘Art’) to get the predictor: • Cycles = 75 + (Opi + Opc) + 3.4*IF + 20*SUB • On back-substitution, Error range was -30% to +20% • Some doubt that sample set was really drawn from similar enough domains to be meaningful, BUT…..
An operative interpretation of the equation • If Cycles = 75 + (Opi + Opc) + 3.4*IF + 20*SUB • Then one might interpret (note- this is statistically invalid) that each task takes • 75 cycles to start and finish (prologue and epilogue) • each basic integer (Opi) and character (Opc) operator is 1 cycle • each branch (IF) ‘attracts’ 3.4 cycles on average • each Subroutine call and return takes 20 cycles • this last implies an average of 5 user registers in use • Although invalid, this predictor ‘makes some kind of sense’ (æsthetically and psychologically)
Discriminating Code Application Domains • This study only just started • Basic idea: • Find a discriminating test to determine if a predictor equation derived from one sample set can be applied to another, new set of code samples • I.e. measure the legitimacy of using a predictor on a new set • One suggestion is to look at ‘Control’ vs. ‘Computation’ dominated code • Idea is to classify virtual instructions as ‘control’ or ‘computation’ and compare their ratios
Ratio of Control to Computation Virtual Instructions where OP.n represents OP.c, OP.s, OP.i, OP.l, Op.d, Op.f MUL.n represents MUL.c, MUL.s, MUL.i, MUL.l,MUL.d, MUL.f DIV.n represents DIV.c, DIV.s, DIV.i, DIV.l, DIV.d, DIV.f If the Control to Computation Ratio is greater than 2/3, then the VPM should provide reasonable accuracy estimates.
A simpler approach • This approach seemed too variable when applied to our benchmark sets • We looked at a simpler ratio • number of Virtual IF’s to total Cycle count • on the 35 ‘automotive control’ examples, this ratio ranged from 9 to 13% • on the 6 ‘Esterel’ examples, this ratio ranged from 1 to 5% • suggests that perhaps these 2 sample sets are NOT drawn from the same population, and therefore a predictor from one set will NOT work on the second • True in practice: using the a predictor from the first set, on the second gave error ranges of 23 to 60% !
Is there a statistical test that can help? • 2-sample t-test (and Aspin-Welch unequal-variance test) • Used to test the hypothesis that 2 sample sets are drawn from the same underlying population • assumes that they are normally distributed • t-test assumes that they have equal variances and tests if the means are equal • Aspin-Welch assumes that they have unequal variances and tests if the means are equal
We applied these tests to our 18 and 17 sample ‘automotive’ SW sets • Discriminator was the ratio of IF’s to total cycle count • Tests passed - I.e. it is possible that the 2 samples were drawn from the same underlying population • Normality of sample 1 under question
T-test applied to ‘automotive’ vs. ‘Esterel’ Hypotheses soundly rejected Normality of 6-sample Esterel set very doubtful! (Sample size too small)
Conclusions • The statistical analysis method seems to provide: • improved and more robust estimators than data sheets • better centred and less likely to produce wild outliers • some ability to discriminate among domain sets of SW tasks • Hampered by lack of benchmark examples • very hard to obtain especially for multiple domains • since statistical, need lots of samples drawn from a wide variety of implementations • Needs to be rerun on other processors (just one used so far) • Variant HW features may mean applicable only to very simple embedded RISCs • Users find it very hard to interpret the predictor equations • they expect the coefficients to be all positive and make ‘sense’
Future improvements under study • Improved Compiler front-end • Target-Independent Optimisations incorporated • May yield different Virtual instruction counts and thus better predictors of cycle count • Other processors • Need cycle-accurate ISS’s from vendors • looking at DSP’s to study limits of technique • Better benchmark sets • need non-proprietary benchmarks which work on a variety of embedded processors • EEMBC Benchmark Suite (www.eembc.org) - EDN Embedded Microprocessor Benchmark Consortium
EEMBC benchmarks • Cadence joined EEMBC as a 3rd party tool provider to get access to benchmark code • Automotive/Industrial • e.g. table lookup, angle to time conversion, pulse width modulation, IIR filters, CAN remote data request, …. • Consumer - e.g. JPEG compression and decompression • Networking - e.g. path routing • Office Automation - e.g. printer control • Telecommunications • e.g.autocorrelation, Viterbi, convolutional encoding, ...