Download
1 / 14
140 likes | 242 Views
A multi-colour survey of NGC253 with XMM-Newton. Robin Barnard, Lindsey Shaw Greening & Ulrich Kolb The Open University. Overview. X-ray populations of galaxies and what we think they mean NGC253, and our analysis of XMM data… Comparison of best fit luminosities vs. standard model

E N D
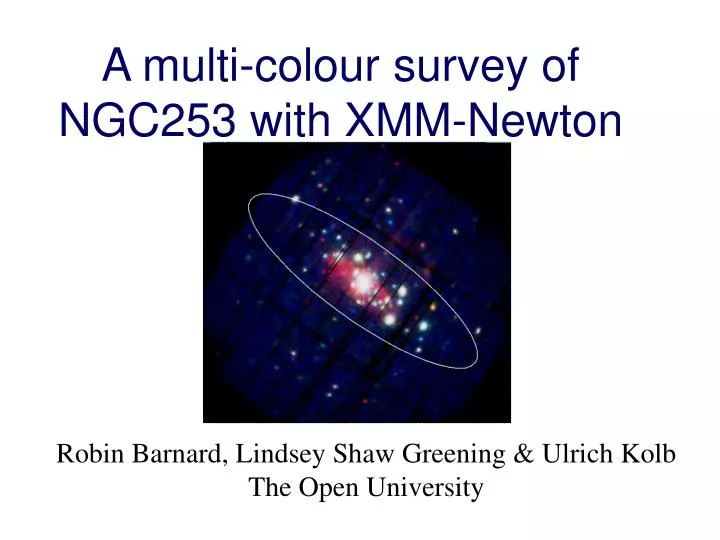
A multi-colour survey of NGC253 with XMM-Newton Robin Barnard, Lindsey Shaw Greening & Ulrich Kolb The Open University
Overview • X-ray populations of galaxies and what we think they mean • NGC253, and our analysis of XMM data… • Comparison of best fit luminosities vs. standard model • XLFs and total LX inside and outside D25 region of NGC253 • Conclusions
X-ray populations of galaxies • Point X-ray emission of external galaxies dominated by X-ray binaries (XBs) • LMXBs from old population, LMXB numbers related to galaxy mass • HMXBs young and short lived, hence numbers are dictated by ongoing star formation rate • Extragalactic X-ray binaries often too faint for us to model their X-ray spectra • Hence, fluxes are often estimated from count rates, assuming a particular emission model • Power law with spectral index 1.7, or 5 keV bremsstrahlung are commonly used • Alternatively, best fit to summed point source emission spectrum is sometimes applied
X-ray vs. Star Formation Rate • Grimm et al. (2003) tried calibrating SFR with total HMXB LX for a sample of local galaxies with high SFR/mass so LMXBs can be ignored • They found that XLFs normalised by SFR to be ~same… “Universal XLF” • They also found relation between SFR and: • integrated X-ray luminosity of galaxy (linear at SFR > ~4 MSun/yr) • No. of sources with 2-10 keV luminosity >2x1038 erg/s NGC253: SFR = 4.0 Lx = 5x1039
NGC 253 • ~Edge on starbursting spiral galaxy in Sculptor group (~4 Mpc) • ~25 x 7 arcmin2 • X-ray view shows what NGC 253 might look like if standard model were true
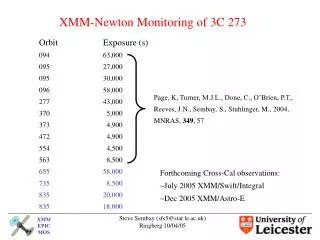
XMM observations of NGC253 0.3-2.5 keV 2.5-4 keV • XMM obs in 2000 & 2003 • Combined source list 185 sources • Chandra observed 140 sources, 3 confused 4-10 keV Central region, linear scale Fullimage, Hist-eq scaled
Source analysis • Made source extraction regions 12-40” radius (mostly 20”) • Extracted 0.3-10 keV pn and MOS spectra and lightcurves • For each spectrum, got corresponding RMF and ARF files • Selected corresponding background regions: • On the same CCD as the source region • At a similar off-axis angle • Source free • At similar distance from readout edges in pn • Area 1-36 x source area ( > 3 x for 75% of sources) • Obtained background lightcurves and spectra corresponding to source regions
Fluxes from different methods • APPROACH 1: Flux obtained from best fit model • Freely modelled 0.3-10 keV spectra for 140 sources with >50 source counts in pn or combined MOS1+MOS2 spectra. • APPROACH 2: Flux obtained from intensity, assuming standard model • We corrected for vignetting and encircled energy fraction (extraction radius, off-axis angle, energy) • For conversion factor from intensity to flux, we obtained the 0.3-10 keV flux equivalent to 1 count/s for standard model (power law with G = 1.7) with nH = 1.3x10²¹ for an on-axis source region with 15” extraction radius (following the HEASARC tool WebPIMMS) • We then compared resulting fluxes
Comparing SM with best fit fluxes • Here we compare SM fluxes (red dots) with 90% upper and lower limits from best fit models (lines) • SM OK for faint sources, underestimates brighter
Difference due to NH? • Required absorption for SM to have same total L as best fits is ~ 7.1 x 10²¹ atom/cm2 • This is 25 s higher than the mean measured absorption (2.0+/-0.2 x 1021 atom/cm2) • Discrepancy instead due to spectral differences… very luminous sources are have much softer spectra than standard model, and hence are poorly represented
Bright source fit vs. SM • Folded spectrum: best fit and SM have same area under curve, i.e. same count rate • However, SM appalling fit • Unfolded, unabsorbed spectrum reveals huge difference in flux • Hence SM drastically underestimates luminosities of bright sources
In D25 (77) Out D25 (92) Best fit SM Best fit and SM LFs (1)
Best fit and SM LFs (2) • Number density of NGC253 sources (red) 3.6 times higher than for sources outside D25 (blue): sources outside likely bg. • Total LX for best fits 2.8 times greater than SM inside D25… total LX for best fits 2.1 times greater outside D25, hence difference is not systematic • Empirical relation between N (L>2x1038) and SFR (Grimm et al. 2003): SM gives ~1.7 Msun/yr, fits give ~4 Msun/yr • Using a power law with mean G and NH yields fluxes 1.6x higher than SM… not perfect because high L sources systematically softer
Conclusions • XLFs of local galaxies used to link X-rays with mass and SFR of distant galaxies. Such work often assumes a standard emission model for all sources • Our detailed study of NGC253 with XMM shows that the SM underestimates high L sources… • “Universal XLF” too steep • Total LX to low • N (L2-10 >2x1038) too low • Better calibration requires close study of more nearby galaxies