Download
1 / 47
490 likes | 750 Views
Tropical Cyclones. Mostly work within the National Oceanic and Atmospheric Administration in the U.S.A., especially the Hurricane Research Division, HRD at AOML. Presented by Kristina B. Katsaros

E N D
Tropical Cyclones Mostly work within the National Oceanic and Atmospheric Administration in the U.S.A., especially the Hurricane Research Division, HRD at AOML Presented by Kristina B. Katsaros former director of Atlantic Oceanographic and Meteorological Laboratory AOML now retired. Material from Frank Marks, Pete Black, Mark Powel and others of HRD and Paris Vashon of Canada Centre for Remote Sensing, W. Timothy Liu of the Jet Propulsion Laboratory and Susanne Lehner of the Deutsche Luft-& Raumfahrt, Tropical cyclone talk at Sputnik 50 year Symposium
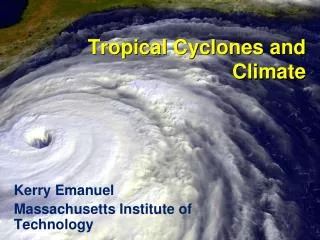
Two Atlantic hurricanes: Floyd (1999) and Andrew (1992), seen from the GOES satellite in visible light at the same scale (note the outlines of Florida and Cuba). Floyd was about 1000 km in diameter, while Andrew was half the size at 500 km. Tropical cyclone talk at Sputnik 50 year Symposium
What is the Hurricane Research Division? • This is a division of AOML that is focused on research on hurricanes with historical focus on observations by aircraft – unique in the world. • During the 3-month hurricane season they fly instrumented aircraft in support of the forecasting at the National Hurricane Center, which is part of the U.S Weather Service. Thus, they have an operational role. • Their flight data are complemented with data from Air Force reconnaissance missions. Tropical cyclone talk at Sputnik 50 year Symposium
Tropical Cyclone (TC) Research at AOML • Research involves: • Observation targeting strategies to improve hurricane track forecasts • Operational five-day tropical cyclone ensemble forecasts with a barotropic model • A climatology and persistence baseline model for hurricane rainfall forecasts • Operational real-time surface wind analyses • Statistical prediction of rapid intensification • Deployment of the Stepped-Frequency Microwave Radiometer (SFMR) on all reconnaissance aircraft Tropical cyclone talk at Sputnik 50 year Symposium
24 h tracks of the 1989-2000 cases of rapid intensification (maximum wind speed increase of 30 kt or greater over 24 hr) Tropical cyclone talk at Sputnik 50 year Symposium
View of low-level clouds swirling in the center of Hurricane Floyd (1999) as seen from the window of one of NOAA’s WP-3D reconnaissance aircraft. The WP-3D’s wingtip appears in the upper left corner. The eyewall rises up in the far right corner another 10 km or so above the aircraft flight level which is at 4 km elevation. Tropical cyclone talk at Sputnik 50 year Symposium
Wind speed data collected by the aircraft’s Stepped-Frequency Microwave Radiometer (SFMR) during a transect through Hurricane Floyd. Flight level winds at 4 km are higher, as expected. Yellow symbols are from dropsonde data: squares represent the highest wind speeds measured; inverted triangles represent 100-m winds; and circles represent the last measured winds, i.e., surface wind speeds below 10-m height. The bottom trace is the rain rate. Tropical cyclone talk at Sputnik 50 year Symposium
Surface wind analysis plot for Hurricane Michelle (November 4, 2001). Wind analyses are used for determining the intensity and radial extent of the maximum sustained wind in tropical systems. Tropical cyclone talk at Sputnik 50 year Symposium
Global Ocean Observations Support TC Prediction AOML collects data and operates data centers for weather and longer-range forecasts, as well as for climate studies: • Drifting buoys • Expendable bathythermograph (XBT) lines • Argo • SEAS (Shipboard Environmental data Acquisition System) work: Voluntary observing ship data from certain ships (350 ships), approximately half of NOAA’s observing ships • Organization of and quality control of data furnished to GTS network and NWS Tropical cyclone talk at Sputnik 50 year Symposium
Researchers at AOML/HRD • They keep up on new satellite data—in particular scatterometers, microwave radiometers and sounders, radars, such as the TRMM rain radar and SAR from RADARSAT-1. • Historically they have been collecting radar data from 1 or 2 aircraft, even producing Doppler wind fields from such data. Tropical cyclone talk at Sputnik 50 year Symposium
Liu, W.T., 2001: Wind over troubled water. Backscatter, 12, No. 2, 10-14.
Revisits by scatterometers for 1 to 4 instruments(courtesy W. Timothy Liu, Jet Propulsion Laboratory, California, U.S.A.)---6 hourly revisits could be possible!
85 GHz Example of Developing Tropical Cyclone Zeb….. Images of the SSM/I 85 GHz channel can produce detailed images of the structure of tropical cyclones. Able to penetrate cirrus, which dominates visible and infrared images, the 85 GHz channel is sensitive to precipitation and clouds at low and medium levels. It gives valuable clues concerning the intensity and position of storms. Naval ReseachLaboratory maintains global collection on the web. (G. Hawkins et al) Tropical cyclone talk at Sputnik 50 year Symposium
Hurricane Modeling and Simulation carried out at Geophysical Fluid Dynamics Laboratory of NOAA The Hurricane WRF (weather research and forecast) model has been developed over a 5 year period and is now being tested. Multiple nesting and coupling with upper ocean model are goals. 5 km resolution is an aim. Modeler has been hired at HRD to work with the observational folks. Tropical cyclone talk at Sputnik 50 year Symposium
The average NHC track and intensity forecasts for the period 1993-1997. Errors were normalized by the average errors from climatology and per-sistence models (CLIPER for track and SHIFOR for intensity). A negative normalized error indicates improvement over climatology and persistence (forecast skill). Tropical cyclone talk at Sputnik 50 year Symposium
40-member orthonormalized bred-mode VICBAR ensemble. Note the easternmost ensemble member with a forecast track along the southeastern Florida coast. This track was not the most likely track, a slight possibility existed that Irene would follow this track. Operational forecast models initialized at the same time as the VICBAR ensemble. Note that none of the operational models forecasted the track up the east coast. The actual track is “BTRK.” The VICBAR ensemble was able to show the possibility that the actual track would occur, whereas the deterministic models were unable to do so. Tropical cyclone talk at Sputnik 50 year Symposium
Predictor Definition RI threshold PER (ms-1) Previous 12-h intensity change 4.6 SST (C) Observed sea-surface temperature at T = 0 h 28.4 POT (ms-1) Maximum potential intensity-initial storm intensity at T = 0 h 47.9 SHD (ms-1) 850 – 200 mb vertical shear at T = 0 h 4.9 RHLO (%) 850 – 700 mb mean relative humidity at T = 0 h 70 The predictors and rapid intensification (RI) thresholds used in the SHIPS RI index. The SHIPS RI index was made available operationally at the NHC on 2 August 2001. Tropical cyclone talk at Sputnik 50 year Symposium
New Thrusts • Ozone measurements in hurricanes (since 1997 by AOML chemists). Ozone is a tracer for vertical motion. • Saharan dust observations from satellites during 2001. The dust is a tracer for dry air from Africa and may be important for TC weakening. • Buoy and altimeter measurments of upper ocean heat content. • Synthetic aperture radar from RADARSAT shows secondary flows and structure in surface wind around eyes. • Wave spectra work with surface contour radar (Ed Walsh, NASA/ETL). Tropical cyclone talk at Sputnik 50 year Symposium
Chemistry measurements gathered during Hurricane Floyd, September 1999. (a) Floyd near maximum intensity (category 4), aircraft heading southwest; (b) Aircraft heading westward over Eleuthera, Bahamas; and (c) aircraft heading northeast, just prior to landfall near Cape Fear, North Carolina at 06:30 z onSeptember 16, 1999. Tropical cyclone talk at Sputnik 50 year Symposium
In cooperation with NAVOCEANO, AOML annually deploys an array of buoys in the tropical Atlantic prior to the hurricane season that measure sea surface temperature, barometric pressure, wind speed, and wind direction. Data from these buoys are available in real time through the GTS system and aid researchers in the prediction and forecasting of hurricanes. Tropical cyclone talk at Sputnik 50 year Symposium
Objectively analyzed heat content (color: KJ cm-2) and the depth of the 26C isotherm (contour in meters) for a) pre-hurricane Gordon, and b) tropical storm Helene. Data derived from the NOAA WP-3D research flights in late September 2000 based on a combination of AXCPs (star), AXCTDs (diamond), and AXBTs (circle) relative to the storm track and intensity (wind speed). Tropical cyclone talk at Sputnik 50 year Symposium
Hurricane Erin/SAL Time Series: 2/5/9 September 2001 Yellows and oranges represent the thermal emission from Saharan dust at ~700 mb. Dust is a tracer for dry air and low level wind surge, characteristic of the Saharan air layer. Tropical cyclone talk at Sputnik 50 year Symposium
Erin emerges from SAL Hurricane Erin Intensity 05 September - 15 September 2001 Intensity (kt) Tropical cyclone talk at Sputnik 50 year Symposium
William Drennan, Jun Zhang Rosenstiel School of Marine and AtmosphericScience, University of Miami Jeffrey French NOAA/OAR/ARL Atmospheric Turbulence and Diffusion Division,Oak Ridge, TN (Now at University of Wyoming, Laramie) Peter Black NOAA/AOML, Hurricane Research Division, Miami 27thConference on Hurricanes and Tropical Meteorology, Paper 9C.5Monterey, 26 April 2006 Latent Heat Fluxes in the Hurricane Boundary Layer
↓BAT ←LICOR head Rosemount 102E intake for LICOR SRA↑ • N43 flux instrumentation • - BAT (“Best Aircraft Turbulence”) probe on boom • RECENTLY INSTALLED AFTER MANY YEARS HIATUS • - LICOR LI-7500 hygrometer (modified) • - Gust probes and Pitot in radome and fuselage • - Inertial navigation, GPS systems in fuselage • - Slow response thermistors and dew point hygrometers • - PRT5 radiometer for sea surface temperature
Dalton number at high winds COARE-3 - - - COARE 2.5 — O AGILE Δ CBLAST X HEXOS ◊ GASEX SOWEX □ SWADE CBLAST mean --- HEXOS mean — →CE = (1.1 ± 0.07)x10-3 [ ≈ HEXOS CE] From DeCosmo et al, 1996 →CE independent of wind to 32 m/s → High scatter in CE explained by sampling (high z, short legs) → Expected scatter in <w’q’>: STD/mean = 6.4 (z/UT)1/2 ≈ 0.5; [For HEXOS, STD/mean ≈ 0.1]
The Effect of Roll Vortices on Turbulent Fluxes in the Hurricane Boundary Layer Jun Zhang, William Drennan, Susanne Lehner RSMAS Kristina B. Katsaros & Peter G. Black NOAA/AOML 27th Conference on Hurricane and Tropical Meteorology, 2006 Sea surface at U= 32 m/s
( Conclusions from Jun Zhang et al, 2006) • Our work show the evidence of secondary flow (roll vortices) in the HBL. • The aspect ratio of the rolls in this study is about 1.8~2.2, which is in good agreement with Morrison et al. (2005); Spectral analysis and wavelet analysis show that Hurricane Boundary Layer rolls modulate the turbulent flux with ~20% and ~30% roll-scale contributions to the total momentum flux and humidity flux, respectively. • More HBL flights are needed to test the effect of rolls on heat flux and humidity flux. We also need statistics on how prevalent they are. Support from ONR (N00014-01-F-009), NOAA-OAR (NA17RJ1226) NASA (W-19-835), and Canadian Space Agency
Effects of swell on frictional drag by wind on the sea, Donelan et al 1997
Estimates of precipitation • Frank Marks and colleaagues at HRD/AOML have estimated precipitation in storms using the radiometer onTRMM (Tropical Rainfall Measuring Mission) data with the rain radar for calibration to generate climatological rainfall estimates from hurricanes… examples………… Tropical cyclone talk at Sputnik 50 year Symposium
Precipitation estimates: R-CLIPER (CLImatology and PERsistence) cases. Statistical estimate of rain amount as a function of storm intensity and integrated along the track (color contours denote storm total rain (inches). Danny 97 Best Track (6 h) Andrew 92 Allison 01 Floyd 99 Tropical cyclone talk at Sputnik 50 year Symposium
RADARSAT-1 SAR (left) and TRMM (right) images from Hurricane Mitch on 27 October 1998. The SAR image at 1133 UT covers 184 x 322 km. The TRMM image at 0837 UT has the same orientation as the SAR image and is 1060 x 1100 km. The red box outlines the SAR swath. The color scale is TRMM rainfall in mm/h. Green = 10 mm/h; red = 20 mm/h. Tropical cyclone talk at Sputnik 50 year Symposium
RADARSAT-1 SAR images of five hurricane “eyes” from the 1998-1999 hurricane season. Tropical cyclone talk at Sputnik 50 year Symposium
Hurricane Erin (September 11, 2001) Evidence of Mesovortex in eye? 100 km MODIS: 15:06 R1 ScanSAR: 22:15 Tropical cyclone talk at Sputnik 50 year Symposium
The odd looking eyes explained by theory and seen in observations of hurricane Isabel, 2003- Jim Kossin et al of CIMMS , U. of Wisconsin Tropical cyclone talk at Sputnik 50 year Symposium
Typhone Wilma Tropical cyclone talk at Sputnik 50 year Symposium
Research has its own Goals and Requirements • Certain hypotheses must be tested before application-oriented research can be contemplated • The requirements for new research can be formulated, prioritized, and put on a “sort-of” schedule • For instance, for hurricane intensification, there are known influences whose relative importance are not well understood: • Wind shear in the environment • Source of fuel in terms of deep warm oceanic upper layer and speed of movement of storm over a warm eddy • Upper level vorticity impulses • Vortex dynamics, size (stability, contracting eyewalls) • Remote sensingis aiding in all these areas. Tropical cyclone talk at Sputnik 50 year Symposium
Storms Investigatedcontributed by S. Lehner • Tropical Cyclones: Hurricanes , Typhoons • Marcel,2003, ASAR (A.Reppucci) • North Atlantic Storms • ASAR Newfoundland, • EUMETSAT ASCAT campaign • 12.2.2007 (S.Brusch) • Polar Low • Trondheim, • March 15, 2005 • LOFZY • (A. Blechschmidt)
Mar 15, 2005 Polar Low ENVISAT ASAR WSM acquired at 20:45 UTC MERIS RR acquired at 10:52 UTC MODIS MOD06 L2 acquired at 20:30 UTC
Wind speed [m/s] Hurricane Katrina [Km] Radius of Maximum Wind. 140 Kts Radius of Hurricane force Wind . 65 Kts [Km]
Final Comment • Tremendous progress has been made in recent years—much thanks to satellite data. • International cooperation in increasing sampling is most important—the Candian Hurricane watch project is a case in point. • Coordinated scatterometer orbits and a data center would be most valuable for early detection and better forecasting. Tropical cyclone talk at Sputnik 50 year Symposium
Revisits by scatterometers for 1 to 4 instruments(courtesy W. Timothy Liu, Jet Propulsion Laboratory, California, U.S.A.)---6 hourly revisits could be possible! ALL BENEFIT!
Storms Investigated • Tropical Cyclones: Hurricanes , Typhoons • Marcel,2003, ASAR (A.Reppucci) • North Atlantic Storms • ASAR Newfoundland, • EUMETSAT ASCAT campaign • 12.2.2007 (S.Brusch) • Polar Low • Trondheim, • March 15, 2005 • LOFZY • (A. Blechschmidt)
1997-2000 operational over-water forecast skill relative to the climatological and persistence model (SHIFOR) for all cases with maximum winds 35 kt. Tropical cyclone talk at Sputnik 50 year Symposium
Four G-IV surveillance missions were flown in Hurricane Michelle (2001). Forecast track improve-ments in the AVN model were between 40% and 75% at all forecast times except 12 h and 72 h. This allowed forecasters to correctly predict that Michelle would not strike south Florida as a major hurricane. The surveillance missions improved already very good forecasts. During the first two years of operations (1997-1998), surveillance missions improved track forecasts. Tropical cyclone talk at Sputnik 50 year Symposium
Mar 15, 2005 Polar Low ENVISAT ASAR WSM acquired at 20:45 UTC MERIS RR acquired at 10:52 UTC MODIS MOD06 L2 acquired at 20:30 UTC