Download
1 / 6
60 likes | 135 Views
30000. 29000. 28000. Luciferase activity. 27000. 26000. 25000. 24000. 23000. Rocovitine ( m M). 0. 3. 25. 50. 1.5. 100. 200. 0.16. 0.31. 0.63. 6.25. 12.5. Supplementary Figure 1. B). E1 WT. S393A. (-). (-). FR. mFR. bound. free. A). Clone A. Clone B. 120. 120.

E N D
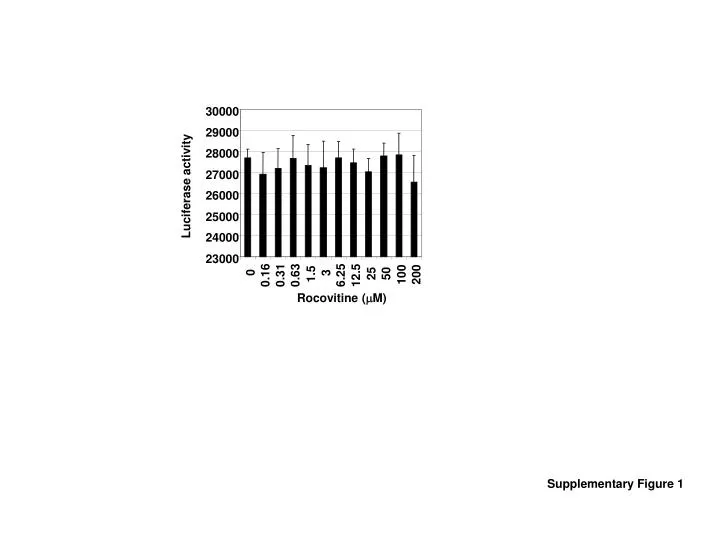
30000 29000 28000 Luciferase activity 27000 26000 25000 24000 23000 Rocovitine (mM) 0 3 25 50 1.5 100 200 0.16 0.31 0.63 6.25 12.5 Supplementary Figure 1
B) E1 WT S393A (-) (-) FR mFR bound free A) Clone A Clone B 120 120 120 120 120 120 120 120 100 100 100 100 100 100 100 100 80 80 80 80 80 80 80 80 60 60 60 60 60 60 60 60 40 40 40 40 40 40 40 40 20 20 20 20 20 20 20 20 0 0 0 0 0 0 0 0 Vector Vector WT S393A WT S393A Supplementary Figure 2
A) ROSC50mM ROSC50mM ROSC50mM ROSC50mM CIP 20 u CIP 20 u CIP 20 u DMSO DMSO CIP 20 u DMSO DMSO (-) (-) CDK1/ cyclinB CK1 aa401-641 aa387-641 E1 CDK1/CycB B) 32P E1 C) aa 388-402 aa 516-530 32P E1 CDK1 /CycB Supplementary Figure 3
Input 2% IP 20% a-CycA1 a-CycB1 a-CycE a-cycC a-Flag FE1 (-) (-) FE1 extract WB : a-E1 Supplementary Figure 4
Tubulin ns - - - - - + + + + + Con E1 WT E1 S393A A) NUC NUC CYT NUC CYT ROSC: (10mM) E1 E1 1 0.4 2.5 3.0 1.9 1.5 E1 Tubulin Sp1 Con E1 WT B) - ROSC(10mM) - + NUC CYT Supplementary Figure 5
S393A WT C) WB -2 Transfect EBNA1 Assay 0 Plate cells 150 158% 4 100 7 32 % WT DMSO Count & Dilute to 0.2x10^6/m WT S393A WT 10 50 S393A DMSO S393A 13 0 WT ROSC SEAP (%) b Gal (%) 14 S393A ROSC S393A WT 16 WB 19 EBNA1 Gardella Cell gel See in B) 21 B) A) EBNA1 EBNA1 S393 WT S393A naked oriP oriP in cell ROCO (20uM) - - + + - + - + ROSC (10mM) .1 .5 ng 11 Day 4 11 4 oriP episome Loading Day 21 in Puro 100 114 73 100 428% 64 Day D) 18 16 14 12 Cell No. (x109) 10 8 6 4 2 Supplementary Figure 6 0 0 4 7 10 13 14 16 19 21 Days in culture in Puro