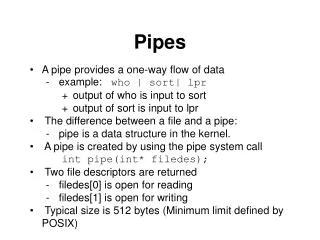
Download
1 / 29
290 likes | 404 Views
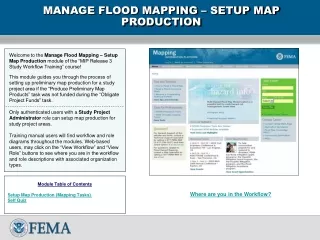
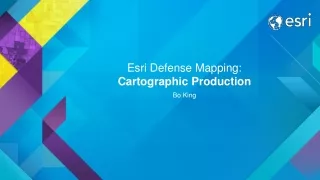
All Pipes Production Mapping. Steve Grisé Solution Architect, Vertex3 October, 2012. Topics. Production Mapping Project Overview Data Model Review and Discussion Process Review and Discussion. Production Mapping In York Region. Planning. Design. Construction. Operations. GIS. GIS.

E N D
All PipesProduction Mapping Steve Grisé Solution Architect, Vertex3 October, 2012
Topics • Production Mapping Project Overview • Data Model Review and Discussion • Process Review and Discussion
Production Mapping In York Region Planning Design Construction Operations GIS GIS GIS GIS Processes Posting Job/Edit Session Editing Steps Job QA/QC
Regional Data Sharing Other Regions York Region Hydraulic Modeling regional All Pipes King Analysis and Reporting Whitchurch-Stouffville … GIS Processes Job/Edit Session Editing Steps Job QA/QC Posting QA/QC Extract
Production Mapping • Data Reviewer • QA/QC • Define Workflows • Job • Workflow steps and tools • Raise the bar for data quality and consistency • Distributed editing based on agreements
Drivers • Local Participation • Meet local business needs • Daily Operations • Summary – Reporting and Compliance • Asset Planning and Management • Regional needs met as a by-product of meeting local needs • Incentives and agreements will have some impact on data model/processes over time • What are your drivers?
Best Practices for W/WW • GIS updated from Drawings/As-Builts • Represents the asset in the organization • Often integrated • Asset Management – Reporting • Asset Management – Operations and Engineering • Network Analysis • Maturity • Data Model • Tools/Applications • Integration • Processes and Data Quality
What is a Data Model? • A representation of the real world in a computer system • Supports business applications and business functions • Defines the set of information products/information we can access • Defines the work that needs to be done to manage the information • An agreement with choices and decisions
Application-Driven Design • Define the information products required • Break down into layers, reports, others • Design datasets to support the layers • Best Practices are iterative 3 2 4 5 1
Purpose of the Data Model • Primary goal is to produce a regional GIS database • Region-wide • Current • Supports Integration • Managed in partnership with Local Area Municipalities (LAMs) • Enterprise Data Warehouse • What are your needs?
Content Review • Starting Point • Modeling Task Force at York Region • Existing GIS data/models • Existing Network Analysis data/models
Next Steps • Refine based on information products/needs • Driving forces • Asset Management at York Region • Asset Management for LAMs • Reporting requirements – MOE and others • Operations • Multi-jurisdictional issues like Inflow and Infiltration • All Pipes Model will be the core data structure that groups will extend for their purposes • … and possibly share at some point…
Regional Data Sharing A Export QA/QC B C A A B Load Export QA/QC B D F A Export QA/QC B E
Regional Data Sharing A B F Access By Partners
Challenges • Closest-to-source QA • One-touch editing • Quality, currency • Sustainment • Skill Sets • Resources
Next Steps • Review with stakeholders in different areas • Collaboration • Maximo-GIS integration • All Pipes Implementation pilot(s) • Data Model Refinement • Process and rules definition • Others based on your feedback • What do you want to see?
Outcomes Centralize data, provide easy access to partner organizations, reduce requests/efforts/redundancy Optimize Development activities in the Region so that new customers are located close to water/wastewater capacity Locate assets quickly and identify ownership/maintenance responsibilities Improve visibility into volume and billing data
Design Process • What map layers can I see and interact with? • Where does the Data come from? • What Impact is there on All Pipes sharing and Production Mapping work? Analysis and Planning Operations Assets Landbase
Possible Impacts • Need Customer Counts for Mains • Annual Consumption/Available capacity • Local Official Plans • Building Permits • Local self-reporting on G/Y/R • Identifying Properties with Development Potential/Priority ranking
Your Outcomes • What do you want to see? • What layers/data do you need? • Is there an impact on • Data warehouse • Data sharing • Process for you and partners • What information can you provide?
Current Situation in York Region • Data Status • Completeness • Currency • Content • Many good people have worked hard to get to this point • The Region and partners are spending significant $ on data • Lots of work to be done