Download
1 / 31
320 likes | 391 Views
Quenching : How to Move from the Blue Cloud Through the Green Valley and to the Red Sequence in 9 Easy Steps in the Face of Downsizing. C. Steidel (Caltech). Galaxy Formation: What are we missing?. Some Questions:.

E N D
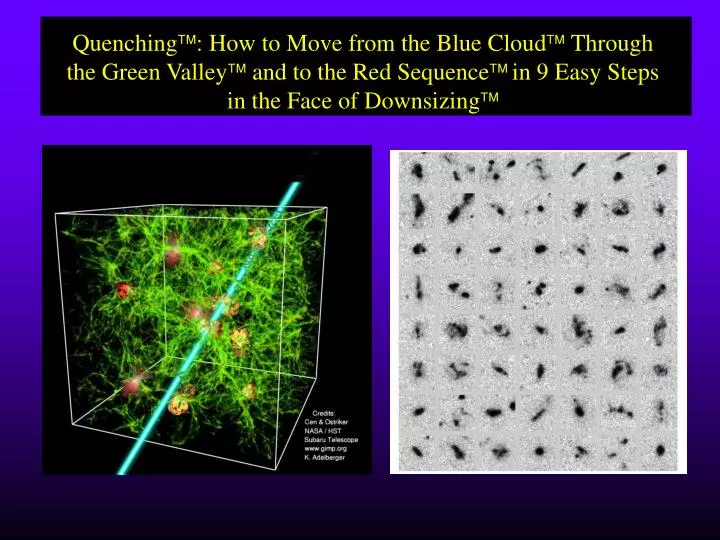
Quenching: How to Move from the Blue Cloud Through the Green Valley and to the Red Sequencein 9 Easy Steps in the Face of Downsizing C. Steidel (Caltech) Galaxy Formation: What are we missing?
Some Questions: • How efficient is galaxy formation as a function of time, environment, mass? • Do we understand gas cooling and star formation on galaxy scales? • Feedback in general: is it needed, is it observed, how does it modify the process? • What process ends major star formation in galaxies? • AGN: when do they happen, how do they influence the life of a (massive) galaxy? • Where or how do “massive galaxies’’ fit in with other galaxies? • What did they look like when they were forming most of their stars?
Using optical (rest-UV) and near-IR (rest optical) to quantify physical properties of z~2-3 galaxies • Optical spectra: • IMF • stellar photospheric abundances • ISM metallicity • ISM kinematics • Near-IR spectra: • Kinematics/dynamical masses • Ionized gas metallicity • SFR estimate • (cold) gas mass estimates • precise redshifts!
Bolometric Luminosity vs. Stellar Mass Note that only ~20% of “red” z~2 galaxies are consistent with being passive. The rest are dusty LIRG-ULIRGs. Reddy et al 2006; see also Papovich et al 2006
Galactic Scale Outflows are Ubiquitous @ high redshift • Typical mean velocities are ~200-400 km/s with respect to nebular line (systemic) redshifts • Typical line widths are ~650 km/sec (barely resolved in typical spectra) • Difference between Ly alpha emission peak and interstellar absorption centroid is ~650 km/s at both z~3 and z~2; full velocity fields of +/- 500-1000 km/sec • Close to unity covering fraction is common • Lines of all accessible ionization stages seen (e.g., OI to OVI) Ly emission relative to H emission <vISM> relative to H emission CS et al 2006
Sample of ~100 galaxies with accurate (H) systemic redshifts, good UV spectra Blue: Mbar<5x10¹⁰ M Red: Mbar>5x10¹⁰ M (Mbar=M*+Mgas) Vmax ~800 km s-1 CS et al 2006
vabs~1000 km s-1 OSIRIS+LGSAO: Spatially Resolved Emission Line Mapsof z~2-3 Galaxies 0.05” Resolution Collapsed [O III] line flux map for a galaxy at z ~ 3 which shows velocity shear of ~ 150 km/s over 4 kpc. Shear was previously undetected with long-slit spectrographs. Collapsed H line flux maps for galaxies at z ~ 2 which show no coherent velocity shear and ~ 80-100 km/s. Law et al 2006
Stellar Mass/Metallicity Relation at z~2.2 No Lum-Metallicity Relation Based on H-alpha (K-band) Spectroscopy of ~90 z~2-2.6 galaxies Erb et al 2006
Mass Comparisons, z~2 star forming galaxies(masses on physical scales of r~5 kpc) Dynamical vs. M* Dynamical vs. (Mgas+M*) Erb et al 2006b
Gas Fraction vs. Stellar Mass, z~2-2.5 star forming galaxies (H sample, rest-UV selected) Gas fraction inferred from H surface brightness, inverting Kennicutt/Schmidt Law Erb et al 2006b
“Specific Star Formation Rate” vs. Stellar Mass @z~2 Blue/yellowdots: rest-UV selected Red boxes: DRGs triangles: BzK SFR/M* Reddy et al 2006
Simple Chemical Evolution Models, z~2 Galaxies Metallicity Yield of Salpeter IMF (Cold) Gas Fraction () Curves: Black: Closed box (no outflow) Blue: outflow=1xSFR Green: outflow=2xSFR Red : outflow=4xSFR Erb et al 2006a
What Does All of this Mean? • Almost looks like galaxies receive their full gas supply at the beginning of an extended starburst episode, which is then “processed”, much of which (~80%?) leaves the galaxy and ~20% of which becomes stars. • a typical galaxy in SF samples is 50% cold gas and 50% stars in the central few kpc @z=2-3 (accounts for ~30% of total baryons given halo masses of ~1012 M). • low stellar mass objects in current samples are not low mass objects, they are just almost entirely gas and very young. • Range of properties among star forming galaxies is dictated by where we catch them in working their way through their gas supply • Because high stellar mass galaxies have low gas fractions, both the ISM metallicity and the opacity increase very rapidly, hence they are extremely dusty just prior to running out of gas. • clear evidence for increasing prominence (or duty cycle) of AGN in high stellar mass, low gas fraction objects (~25% compared to ~3-4% in lower stellar mass objects) • most of the gas is already gone by the time this occurs (though SFR can still be fairly high).
Galaxy/AGN/IGM Interface @High Redshift • Use dense sampling of galaxies, AGN to try to directly detect signatures of feedback (both radiative and hydrodynamical) • true IGM “tomography” is possible now.
Densely Sampling the Universe @z~1.8-3.2 Foreground Background QSO z
Galaxy/CIV Cross-Correlation: 542 CIV systems, 1044 Galaxies • Above N(CIV)~1013, galaxy/absorber cross-correlation is equal to or exceeds the galaxy auto-correlation function • Suggests causal connection of the strongest systems with the observed galaxies. • In any case, metals (as traced by CIV) are where the observed galaxies are. Adelberger et al 2005
QSO sightline, 85 kpc away Galaxy BX210: v~660 km/sec vmax~ -600km/sec
2 sightlines separated by 0.45 kpc @76 kpc distance from z=2.356 galaxy (separate gravitationally lensed images of the QSO)
Separation: 43 kpc (proper) • MD80: M*=5x10⁹ Msun • BX513: M*=1011 Msun • High ions >> low ions, at same velocity in MD80 spectrum and in BX513 spectrum Z=2.012 Z=2.109 ~20 hours, Keck/LRIS-B
Where are the QSOs/AGN relative to the galaxies @z~2-3? Adelberger & CS 2005a,b
Where are the QSOs/AGN relative to the galaxies? z~2-3 galaxies galaxy-galaxy correlation length Adelberger & CS 2005
Inferences about Black Hole Masses and Host Halos at z~2-3 Adelberger & Steidel 2005b
Environments of Very Bright QSOs (m~16-17) @z2.5-2.8 In 12 fields of ultraluminous QSOs, only 1 bright QSO is in a substantial over-density: HS1549+19 @z=2.84
AGN and Star-forming galaxies at z~2-3.5: • Bright and faint (optical) AGN, over ~ 10 mags of dynamic range, inhabit essentially the same dark matter halos and the same environments as the blue star-forming galaxies in the spectroscopic sample • r0~5h-1 Mpc at z~2-3, independent of AGN (UV) luminosity • Significantly weaker clustering than red galaxies at similar redshifts (cf. Quadri et al 2006- see also his poster) • Faint AGN have much longer duty cycle (they are “on” for a much larger fraction of the time) than bright ones • Apparently, quasars cluster like ~ L* star forming galaxies (galaxies with the largest gas supplies) at all redshifts • e.g., Coil et al 2006 z~1: r0~3.7h-1 Mpc
HS1700+64 z=2.300 Proto-cluster • Data Include: • Optical and near-IR spectroscopy (Keck) • Deep J,K imaging (Palomar) • Deep H (2.17m) (Palomar, 25 hours) • Ly imaging (in progress) • HST/ACS • Chandra (coming soon) • Spitzer/IRAC, extremely deep MIPS 186 spec. 1.7<z<3.2 8 AGN
Inferred Properties vs. Environment Spike: <Age>=1450 Myr Field: <Age>=700 Myr <M*>spike/<M*>field=1.8 CS et al 2005
HS1700+64 z=2.300 Proto-cluster “Map” Black: spec. confirmed z=2.30 (rest-UV selected) Blue: H n.b. candidate z=2.30 Red: all DRGs K<21.0 Green: Ly n.b. candidate
“(Some) Ways Forward” • Establish the details of the spatial relationship between galaxies and AGN/QSOs at the redshifts where big galaxies are emerging. • Lots of spectroscopy is required, both optical and near-IR • Understand “feedback” processes: beyond “hand waving” • Would like in situ, not just circumstantial, evidence • Probably involves observing gas, not stars • Do we really understand the implications of “down-sizing”? • Are we missing something important in our understanding of how gas cooling/SF works at high redshifts?