Download
1 / 25
250 likes | 432 Views
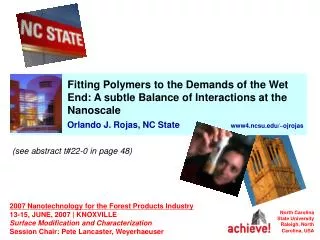
North Carolina Water Science Center. Ecological responses of streams to urbanization: A review of results from the U.S. Geological Survey's urban streams studies. Thomas F. Cuffney North Carolina Water Science Center Raleigh, North Carolina.

E N D
North Carolina Water Science Center Ecological responses of streams to urbanization: A review of results from the U.S. Geological Survey's urban streams studies Thomas F. Cuffney North Carolina Water Science Center Raleigh, North Carolina
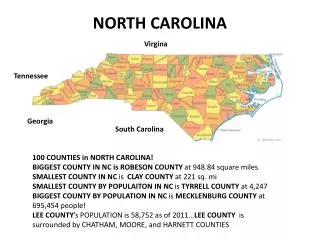
National Water-Quality Assessment (NAWQA) Program 11 Urban Stream Studies Seattle Portland Milwaukee-Green Bay Boston Salt Lake City Denver Sacramento Raleigh Birmingham Atlanta Dallas-Ft. Worth
Raleigh Urban Study Area Piedmont
Objectives: • Define biological, physical, and chemical responses to urbanization across conterminous US. • Identify the primary environmental factors associated with these responses. • Compare how responses and driving factors change across the US. -- What measures best depict urban effects (monitoring)? – What factors can be changed to mitigate urban effects (planning and remediation)? – Can urban effects be managed using national criteria or are regional or local criteria required (management and legislation)?
Representing urban intensity: urban intensity index (UII) Index based on land-cover, population, infrastructure and socioeconomic factors correlated with changes in population density
Urban variables positively correlated with population density
Urban variables negatively correlated with population density
Urban intensity index (UII) Raleigh Example: Census variables: 2000 population density Household density National Land-cover Data: % of basin in developed lands % of stream buffers in developed lands Infrastructure: road density
Urban intensity (UII) at 10% impervious surface 0.92 0.95 0.88 0.92 0.95 0.78 0.95 0.83 0.88
Biological responses to urbanization Fish, Invertebrates, and Algae
Expected response Good Biological condition (≈ 10 % impervious surface) Poor Urban intensity (UII)
Typical response (Inverts Atlanta) 10% impervious surface 40% of total change Invertebrate response
Boston Fish: Exhaustion Fish response Urban intensity (UII)
Invertebrates responses to urbanization (Y = a + b*UII) across US
Invertebrates responses to urbanization (Y = a + b*UII) across US
Land cover at “background” sites: UII < 20 Forest + shrublands Agriculture Agriculture + grasslands Irrigation? Grazing? % Basin area WEST CENTRAL EAST
Summary of biological responses to urbanization (UII) • Significant relation between urban intensity and biological degradation. • Invertebrates are the strongest and most consistent indicators. • Algae and fish responses are more variable. • Relations were strongest when urbanization involved conversion of forest or shrub lands. • Relations were weakest when urbanization involved conversion of agricultural or grass lands. • Little evidence for resistance to urbanization (no initial threshold).
Changes in water chemistry associated with urbanization and biological responses
Chemical trends with urbanization • Conductivity • Pesticides: • Number detected • Total concentration • Pesticide index • Nutrients: Chemistry Invertebrates
Chemical trends with urbanization (continued) • Polycyclic aromatic hydrocarbons (PAH): • Number detected • Total concentration • Very few instances where human or aquatic life standards were exceeded. • Relations with urbanization were also affected by presence of agriculture and grasslands (Central: Dallas, Denver, Milwaukee). Chemistry Invertebrates
Hydrologic changes associated with urbanization and biological responses
Key Findings from Urban Studies • Degrades biological communities: • Invertebrates are “best” biological indicator. • No level of urbanization without an effect. • Increases chemical contamination: • Number and conc. of pesticides. • Number and conc. of PAH’s. • Modifies hydrology • Increases flashiness. • Decreases duration of peak flows in many urban areas, but not all.
Key Findings (continued) • Factors associated with urban degradation that may be useful for mitigation: • Decrease effects of road density in basin. • Decrease effects housing density in basin. • Restore forest and shrub lands (basins and buffers). • Restore connection between precipitation, ground water, and surface water (restore normal hydrology). • Responses vary geographically: • East = West in biological (invertebrate) responses. • = Central (agriculture + grasslands). • Extent of “background” degradation affects how biology and chemistry respond to urbanization. • Regional approaches to management and legislation may be required. /