1 / 11
110 likes | 171 Views
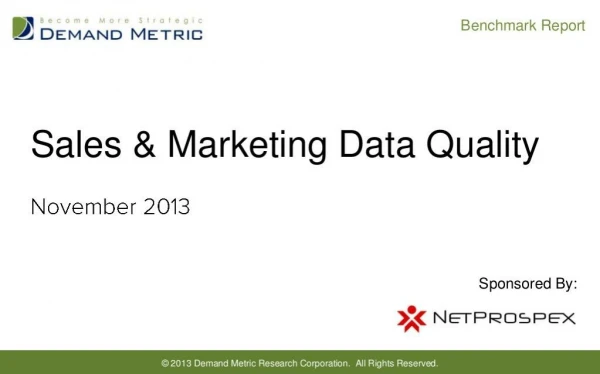
In October 2013, Demand Metric conducted a benchmarking study, with 227 respondents, to understand the relationship between data quality and revenue growth. This report details the results of this study. To read the rest of this Benchmark Report, become a Demand Metric member here: https://www.demandmetric.com/user/register

E N D
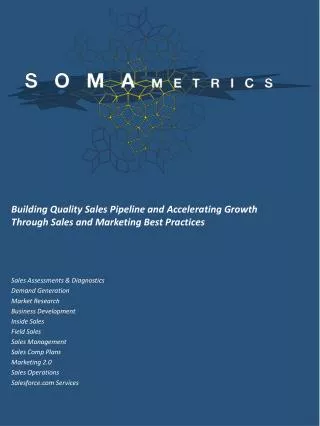
Sales & Marketing Data Quality Benchmark Report Benchmark Report Sales & Marketing Data Quality Sponsored By: © 2013 Demand Metric Research Corporation. All Rights Reserved.
TABLE OF CONTENTS 3 13 5 16 6 18 7 20 8 21 10 22 TABLE OF CONTENTS 3 13 5 16 6 18 7 20 8 21 10 22
EXECUTIVE SUMMARY 62% of study participants report that their volume of sales and marketing data is growing, and for over one-third, the volume is growing 10% or more per year. The dirtiest data resides in Marketing Automation systems. 4 Organizations that are experiencing revenue growth are almost three times more likely to have clean data than organizations with flat or declining revenue growth. EXECUTIVE SUMMARY 62% of study participants report that their volume of sales and marketing data is growing, and for over one-third, the volume is growing 10% or more per year. The dirtiest data resides in Marketing Automation systems. 4 Organizations that are experiencing revenue growth are almost three times more likely to have clean data than organizations with flat or declining revenue growth.
RESEARCH METHODOLOGY Annual Revenues: Type of Organization: Revenue Growth: Primary Role of Respondent: RESEARCH METHODOLOGY Annual Revenues: Type of Organization: Revenue Growth: Primary Role of Respondent:
DATA SYSTEMS A clear majority of study participants indicated that most of their sales and marketing data resides in a CRM system. Sales & Marketing Data Quality Benchmark Report, Demand Metric, November 2013, n=227 6 DATA SYSTEMS A clear majority of study participants indicated that most of their sales and marketing data resides in a CRM system. Sales & Marketing Data Quality Benchmark Report, Demand Metric, November 2013, n=227 6
DATA QUANTITY The number of records stored in systems is growing for 62% of participants in this study, and over one-third report that their record counts are growing at least 10% per year. Sales & Marketing Data Quality Benchmark Report, Demand Metric, November 2013, n=227 7 Over half of the participants indicate that new records are added to their sales or marketing systems on a daily basis DATA QUANTITY The number of records stored in systems is growing for 62% of participants in this study, and over one-third report that their record counts are growing at least 10% per year. Sales & Marketing Data Quality Benchmark Report, Demand Metric, November 2013, n=227 7 Over half of the participants indicate that new records are added to their sales or marketing systems on a daily basis
DATA ENTRY PATHS 72% of all respondents report using it to get data into systems. Sales & Marketing Data Quality Benchmark Report, Demand Metric, November 2013, n=227 8 DATA ENTRY PATHS 72% of all respondents report using it to get data into systems. Sales & Marketing Data Quality Benchmark Report, Demand Metric, November 2013, n=227 8
DATA ENTRY PATHS It is no surprise that 90% of Marketing Automation users are getting data into their systems via direct integration with lead capture forms, because after all, Marketing Automation was developed to track leads from their source. For CRM and email solutions, data entry is the most frequently used method of populating these systems with records. This study did not investigate the reasons why data entry is not producing dirtier data, but we can speculate: those who are entering the data are also users of the systems. The longer dirty data is allowed to reside in a system, the higher the probability that its quality issues will negatively impact the campaigns, people or other systems that try to use it. 9 DATA ENTRY PATHS It is no surprise that 90% of Marketing Automation users are getting data into their systems via direct integration with lead capture forms, because after all, Marketing Automation was developed to track leads from their source. For CRM and email solutions, data entry is the most frequently used method of populating these systems with records. This study did not investigate the reasons why data entry is not producing dirtier data, but we can speculate: those who are entering the data are also users of the systems. The longer dirty data is allowed to reside in a system, the higher the probability that its quality issues will negatively impact the campaigns, people or other systems that try to use it. 9
. DATA QUALITY It’s important to understand the value of having clean data: the dirtier sales and marketing data is, the harder it is to communicate with prospects and customers. Sales & Marketing Data Quality Benchmark Report, Demand Metric, November 2013, n=227 10 Intuitively, marketers understand there is a direct connection between data quality and conversion rates.
. ABOUT DEMAND METRIC To read the rest of this Benchmark Report, become a Demand Metric member today!