1 / 3
30 likes | 46 Views
Get this template plus 350 other premium business tools & templates at www.demandmetric.com

E N D
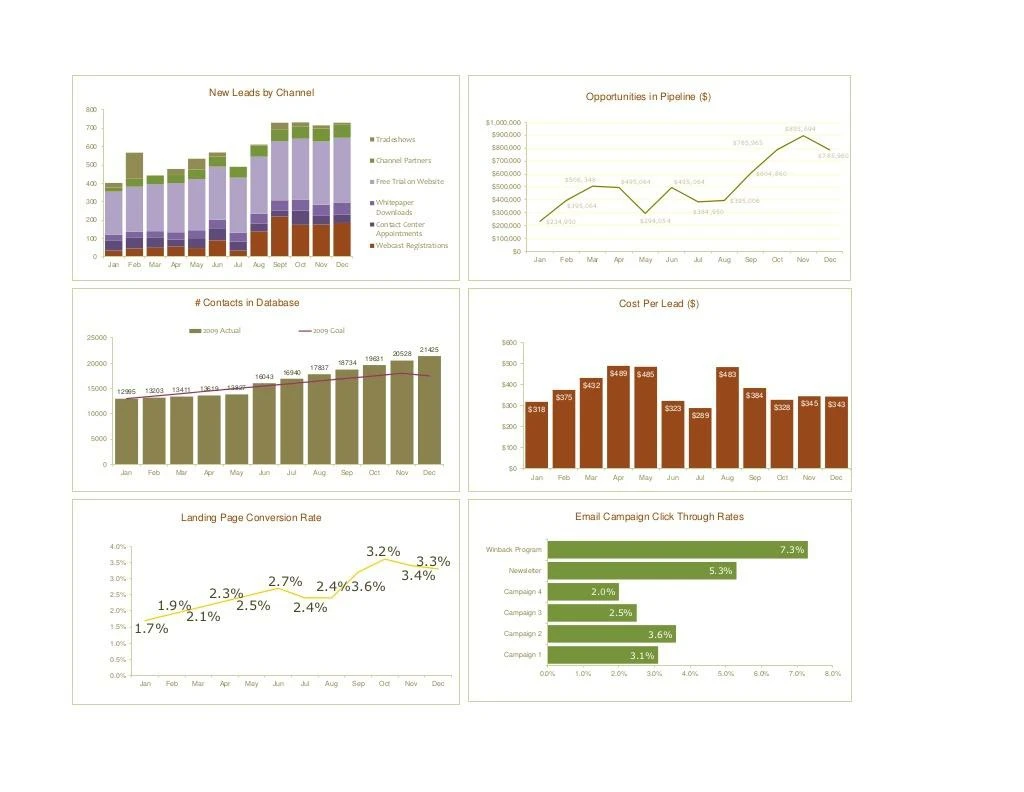
Lead Generation Metrics Dashboard New Leads by Channel Opportunities in Pipeline ($)800 $1,000,000700 $895,694 $900,000 Tradeshows $785,965600 $800,000 $785,960 Channel Partners $700,000500 $600,000 $604,860 Free Trial on Website $506,348 $495,064 $495,064400 $500,000300 Whitepaper $400,000 $395,006 $395,064 Downloads $300,000 $384,950200 $234,950 $294,054 Contact Center $200,000 Appointments100 $100,000 Webcast Registrations $0 0 Jan Feb Mar Apr May Jun Jul Aug Sep Oct Nov Dec Jan Feb Mar Apr May Jun Jul Aug Sept Oct Nov Dec # Contacts in Database Cost Per Lead ($) 2009 Actual 2009 Goal25000 $600 21425 20528 1963120000 18734 $500 17837 16940 $489 $485 $483 16043 13827 $400 $43215000 13203 13411 13619 12995 $375 $384 $300 $328 $345 $343 $318 $32310000 $289 $200 5000 $100 0 $0 Jan Feb Mar Apr May Jun Jul Aug Sep Oct Nov Dec Jan Feb Mar Apr May Jun Jul Aug Sep Oct Nov Dec Landing Page Conversion Rate Email Campaign Click Through Rates 3.2% 4.0% Winback Program 7.3% 3.5% 3.3% 5.3% 3.4% Newsletter 3.0% 2.7% 2.4% 3.6% 2.5% 2.3% Campaign 4 2.0% 1.9% 2.5% 2.4% 2.0% 2.5% 2.1% Campaign 3 1.5% 1.7% Campaign 2 3.6% 1.0% 0.5% Campaign 1 3.1% 0.0% 0.0% 1.0% 2.0% 3.0% 4.0% 5.0% 6.0% 7.0% 8.0% Jan Feb Mar Apr May Jun Jul Aug Sep Oct Nov Dec
Lead Generation Metrics DashboardLead Generation Metrics Q1 Q2 Q3 Q4 New Leads by Channel Jan Feb Mar Apr May Jun Jul Aug Sept Oct Nov Dec Webcast Registrations 34 45 49 55 48 89 34 139 219 174 175 184 Contact Center Appointments 56 58 54 39 54 67 48 43 34 78 48 45 Whitepaper Downloads 31 34 37 40 43 46 49 52 55 58 61 64 Free Trial on Website 234 245 256 267 278 289 300 311 322 333 344 355 Channel Partners 23 43 47 50 53 56 59 62 65 68 71 74 Tradeshows 24 142 0 28 58 21 0 4 35 21 17 8 Opportunities in Pipeline ($) Jan Feb Mar Apr May Jun Jul Aug Sep Oct Nov Dec 2009 Actual $234,950 $395,064 $506,348 $495,064 $294,054 $495,064 $384,950 $395,006 $604,860 $785,965 $895,694 $785,960 Contacts in Database Jan Feb Mar Apr May Jun Jul Aug Sep Oct Nov Dec 2009 Actual 12995 13203 13411 13619 13827 16043 16940 17837 18734 19631 20528 21425 2009 Goal 13000 13500 14000 14500 15000 15500 16000 16500 17000 17500 18000 17500 Cost Per Lead ($) Jan Feb Mar Apr May Jun Jul Aug Sep Oct Nov Dec 2009 Actual $318 $375 $432 $489 $485 $323 $289 $483 $384 $328 $345 $343 Landing Page Conversion % Jan Feb Mar Apr May Jun Jul Aug Sep Oct Nov Dec 2009 Actual 1.7% 1.9% 2.1% 2.3% 2.5% 2.7% 2.4% 2.4% 3.2% 3.6% 3.4% 3.3% Email Marketing Campaigns Click Through Rate Lead Generation Metrics DashboardLead Generation Metrics Q1 Q2 Q3 Q4 New Leads by Channel Jan Feb Mar Apr May Jun Jul Aug Sept Oct Nov Dec Webcast Registrations 34 45 49 55 48 89 34 139 219 174 175 184 Contact Center Appointments 56 58 54 39 54 67 48 43 34 78 48 45 Whitepaper Downloads 31 34 37 40 43 46 49 52 55 58 61 64 Free Trial on Website 234 245 256 267 278 289 300 311 322 333 344 355 Channel Partners 23 43 47 50 53 56 59 62 65 68 71 74 Tradeshows 24 142 0 28 58 21 0 4 35 21 17 8 Opportunities in Pipeline ($) Jan Feb Mar Apr May Jun Jul Aug Sep Oct Nov Dec 2009 Actual $234,950 $395,064 $506,348 $495,064 $294,054 $495,064 $384,950 $395,006 $604,860 $785,965 $895,694 $785,960 Contacts in Database Jan Feb Mar Apr May Jun Jul Aug Sep Oct Nov Dec 2009 Actual 12995 13203 13411 13619 13827 16043 16940 17837 18734 19631 20528 21425 2009 Goal 13000 13500 14000 14500 15000 15500 16000 16500 17000 17500 18000 17500 Cost Per Lead ($) Jan Feb Mar Apr May Jun Jul Aug Sep Oct Nov Dec 2009 Actual $318 $375 $432 $489 $485 $323 $289 $483 $384 $328 $345 $343 Landing Page Conversion % Jan Feb Mar Apr May Jun Jul Aug Sep Oct Nov Dec 2009 Actual 1.7% 1.9% 2.1% 2.3% 2.5% 2.7% 2.4% 2.4% 3.2% 3.6% 3.4% 3.3% Email Marketing Campaigns Click Through Rate
Campaign 1 3.1%Campaign 2 3.6%Campaign 3 2.5%Campaign 4 2.0%Newsletter 5.3%Winback Program 7.3% Campaign 1 3.1%Campaign 2 3.6%Campaign 3 2.5%Campaign 4 2.0%Newsletter 5.3%Winback Program 7.3%