1 / 22
220 likes | 227 Views
Get this template plus 350 other premium business tools & templates at www.demandmetric.com

E N D
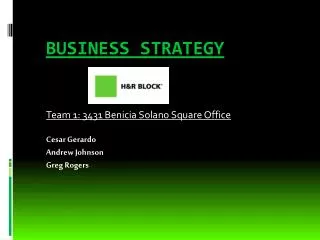
Business Strategy Presentation Overview1.0 Executive Summary2.0 Situational Analysis3.0 Objectives, Initiatives, Metrics, & Targets4.0 GAP Analysis & Program Prioritization5.0 Monitoring & Measurement
1.0 Executive SummaryEnter Key Recommendations & Strategies Here Strategy 1 Strategy 2 Strategy 3 1.0 Executive SummaryEnter Key Recommendations & Strategies Here Strategy 1 Strategy 2 Strategy 3
2.0 Situational Analysis2.1 Core Competencies Assessment2.2 Market Segmentation & Customer Profiles2.3 Competitive Analysis & Positioning2.4 Industry Analysis2.5 Situational Analysis Summary 2.0 Situational Analysis2.1 Core Competencies Assessment2.2 Market Segmentation & Customer Profiles2.3 Competitive Analysis & Positioning2.4 Industry Analysis2.5 Situational Analysis Summary
2.1 Market Segmentation &Customer Profiles – Segment A 2.1 Market Segmentation &Customer Profiles – Segment A
2.1 Market Segmentation &Customer Profiles – Segment B 2.1 Market Segmentation &Customer Profiles – Segment B
2.1 Market Segmentation &Customer Profiles – Segment C 2.1 Market Segmentation &Customer Profiles – Segment C
2.4 Industry AnalysisSocial Technological Economic PoliticalTrend - general talk of Trend - movement toward Trend – lots of budget cuts Trend – organizations usingsustainability issues on-demand customer service and stalled sales compliance as basis for apps solution buildingCondition – most Condition – many Condition – most Condition – we currently docompetitors are doing a organizations provide organizations feeling impact not have any messagingsustainability report customer service portal of recession around complianceImplications – we need to Implications – cost savings Implications – need to Implications – solutions thatcomplete our report on and increase customer remain cash flow positive, address compliance issuessustainability to keep up satisfaction gains to be had if so increased importance on are likely to look favorable.with our competitors and we can develop a solid reducing sales cycle time. Need to start developinguse this as a point of customer support application End of quarter discounts is a compliance focused solutionsdifferentiation. that adds additional value. good temporary solution but before competitors take need a better L/T option market share. 2.4 Industry AnalysisSocial Technological Economic PoliticalTrend - general talk of Trend - movement toward Trend – lots of budget cuts Trend – organizations usingsustainability issues on-demand customer service and stalled sales compliance as basis for apps solution buildingCondition – most Condition – many Condition – most Condition – we currently docompetitors are doing a organizations provide organizations feeling impact not have any messagingsustainability report customer service portal of recession around complianceImplications – we need to Implications – cost savings Implications – need to Implications – solutions thatcomplete our report on and increase customer remain cash flow positive, address compliance issuessustainability to keep up satisfaction gains to be had if so increased importance on are likely to look favorable.with our competitors and we can develop a solid reducing sales cycle time. Need to start developinguse this as a point of customer support application End of quarter discounts is a compliance focused solutionsdifferentiation. that adds additional value. good temporary solution but before competitors take need a better L/T option market share.
. 2.5 Situational Analysis Summary Strengths Weaknesses Solid New Product Development Process Poor Information Security & Disaster Recovery Opportunities Threats Growth by cross-selling new products Data vulnerable to virus or security breach
. 3.0 Objectives, Initiatives, Metrics & Targets3.1 Balanced Scorecard Strategy Map Mission & VisionMission Statement -Vision Statement –
. 3.1 Balanced Scorecard Strategy Map - FinancialObjective 1 - Increase Profitability to 12% of Gross RevenuesPrograms, Initiatives, & Actions Key Performance Indicators & Metrics Target Timeframe to Achieve GoalsVendor Consolidation Initiative # Vendors Reduce to 28 by Jun 2010Reduce Customer Churn Rate Retention Rate Increase to 78% by Jan 2010Head Count Reduction # Full-Time Staff Reduce to 150 by Oct 2010Objective 2 - Improve Annual Growth Rate to 9%Programs, Initiatives, & Actions Key Performance Indicators & Metrics Target Timeframe to Achieve GoalsPresidents Club # Reps Achieving 100% of Sales Targets 5 Reps in Presidents Club in 2010Re-Seller Partnership Channel Annual Revenue from Partner Channels $500,000 in Revenue in 2010Acquisitions Annual Revenue from New Acquistions $15M in Revenue in 2010Objective 3 - Increase Available CashPrograms, Initiatives, & Actions Key Performance Indicators & Metrics Target Timeframe to Achieve GoalsA/R Collections Average Days of Receivables 45 Days by June 2010A/P Payment Review Average Days of Payables 60 Days by June 2010Early Payment Discount Program % Invoices Paid with Early Payment Discount 5% of all invoices in Q3 2009
. 3.1 Balanced Scorecard Strategy Map - CustomerObjective 1 - Improve Customer SatisfactionPrograms, Initiatives, & Actions Key Performance Indicators & Metrics Target Timeframe to Achieve GoalsVoice of Customer # New Ideas for R & D 12 New Ideas in 2010Customer Support Portal Portal Launch Date Launch by Oct 2010Customer Satisfaction Surveys Net Promoter Score, # Surveys Completed Get NPS Benchmarks in 2010Objective 2 - Increase Market Share to 25%Programs, Initiatives, & Actions Key Performance Indicators & Metrics Target Timeframe to Achieve GoalsMarket Research Initiative % Market Share Increase to 25% by Jan 2011Service Level Agreement % Support Requests Escalated to Tier 3 > 5% of requests escalated by Jun 2010Marketing Automation Program # New Leads Generate 3,500 Leads in 2010Objective 3 - Provide Low Cost Solution for SMBPrograms, Initiatives, & Actions Key Performance Indicators & Metrics Target Timeframe to Achieve GoalsNew SMB Product Line # New Customers 500 New Customers in 2010Monthly Billing Option # Customers on Monthly Billing 100 Customers in 2010
. 3.1 Balanced Scorecard Strategy Map – Business ProcessesObjective 1 - Implement CRM SystemPrograms, Initiatives, & Actions Key Performance Indicators & Metrics Target Timeframe to Achieve GoalsCRM System Implementation System Go-Live Date Go-Live by Oct 2010CRM Training CRM Adoption Rate 100% Adoption by Staff by Jan 2011Data Migrations # Customer Databases Consolidate to 1 Database by Dec 2010Objective 2 - Improve Staff Recruiting & RetentionPrograms, Initiatives, & Actions Key Performance Indicators & Metrics Target Timeframe to Achieve GoalsHR Information System # Resumes Submitted Online 500 Resumes in 2010Results Only Work Environment Link staff performance reviews to business KPIs Complete KPI mapping by Oct 2010Employee Profiling New Sales Hire Success Rate Increase to 75% OTE by Jan 2011Objective 3 - Disaster Recovery Planning & SecurityPrograms, Initiatives, & Actions Key Performance Indicators & Metrics Target Timeframe to Achieve GoalsDisaster Recovery Plan Plan Completion Completed by Jan 2011Security Auditing Audit Recommendations Received Receive Recommendations in Jun 2010Sarbarnes Oxley Compliance Compliance Achieved OngoingObjective 4 - Reduce Waste with Lean ManufacturingPrograms, Initiatives, & Actions Key Performance Indicators & Metrics Target Timeframe to Achieve GoalsSustainability Report Report Completion Completed by Oct 2010Lean Manufacturing Audit Audit Recommendations Received Receive Recommendations by Jan 2011
. 3.1 Balanced Scorecard Strategy Map – Learning & GrowthObjective 1 - Revamp Employee Training ProgramsPrograms, Initiatives, & Actions Key Performance Indicators & Metrics Target Timeframe to Achieve GoalsSales & Service Training # Staff Trained 100% trained on new methods by Jan 2011Quality Assurance Average Customer Service Call QA Score 3.5 Average QA Score by Oct 2010Dale Carnegie Leadership & Communications # Staff Certified 20 Staff Certified by Jan 2010Objective 2 - Create Career Paths for Each FunctionPrograms, Initiatives, & Actions Key Performance Indicators & Metrics Target Timeframe to Achieve GoalsSuccession Management Develop Succession Management Plan Plan completed by Jan 2011Job Descriptions Job Descriptions Completed Completed by Jun 2010Performance Reviews Performance Review Metrics Add business KPIs to all reviews Oct 2010Objective 3 - Launch Corporate IntranetPrograms, Initiatives, & Actions Key Performance Indicators & Metrics Target Timeframe to Achieve GoalsIntranet Project Intranet Re-launch Date Launch Mar 2011
. 4.0 GAP Analysis & Program Prioritization4.1 GAP Analysis4.2 Program Prioritization4.3 Key Success Factors
. 4.1 GAP Analysis Target Item Current State Goal State Action PlanCustomer Data House in Multiple Systems Centrally Located in Implement CRM System Enterprise CRM SystemLead Generation Process No Scoring, Nurturing, or Marketing Programs Select Marketing Automation Sales Alerts in Place Automated, Sales Reps Platform Integrates Tightly Alerted for Hot Leads with CRM SystemSuccession Planning Not in existence Develop Career Paths for all Complete Skills Inventory, functions, future leaders Develop Succession identified and groomed Management MatrixProduct Development No Formal Process for Making Scorecard System to Rank Create Product Scorecard andDecision Making Go/No Go Decisions Value of Each Development Use at all Process Checkpoints and Review at Checkpoints
. 4.2 Program Prioritization - Rankings
. 4.2 Program Prioritization - Results
. 4.3 Key Success FactorsKey Success Factors Risk Contingency PlanEnd User Adoption Rates for CRM Poor ROI Rate Provide Exceptional TrainingProduct Development Process Definition and Leverage Consultant to get key Product FailureImprovement stakeholders togetherKey Success Factor Risk Contingency PlanKey Success Factor Risk Contingency Plan
. 5.0 Monitoring & Measurement5.1 Business Strategy Metrics Dashboard