Download
1 / 22
230 likes | 412 Views
Stress and Strain. When the forces discussed in our last lesson act on a material, the material is said to be under stress . If a material is being stretched, it is under tensile stress . If a material is being squeezed, it is under compressive stress .

E N D
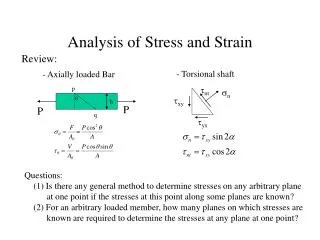
When the forces discussed in our last lesson act on a material, the material is said to be under stress. If a material is being stretched, it is under tensile stress. If a material is being squeezed, it is under compressive stress. When shearing forces act, the material will experience shear stress.
A wooden pole has the dimensions shown in the diagram. Four such poles are needed to support an elevated hut to be used by birdwatchers in a rainforest. If the hut has a mass of 250 kg and holds five adults, determine the compressive stress (in MPa) under which the poles are placed. Assume the mass of each adult and their equipment to be 100 kg.
As we noticed in the questions in our last lesson, concrete features quite a lot in discussions on compressive and tensile strength and how the use of composite materials can help in designing materials to overcome strength problems.
To help remember the difference between stress and strain, you may note that stress is pressure and that strain is length. A 1.3 m steel piano wire with a diameter of 1.5 mm is tightened by a force of 900 N, resulting in a strain of 4.3%. Determine the extension of the wire, and calculate the tensile stress on the wire. Comment on whether you think the wire will fail.
Permanent change to the material (a) Stress and strain plotted for two different materials. Tungsten is stiffer than steel. Steel is more flexible than tungsten. (b) Tensile stress plotted against the corresponding values for the strain for a metal rod that is clamped and subjected to an extending force.
The gradient of a stress–strain graph is a measure of the stiffnessof a particular material or substance. The gradient is called Young’s modulus or the elastic modulus of the material. Material X is stiffer than material Y. X has a greater Young’s modulus (gradient) than Y. Material Y is more flexible than Z and is also stronger than material X. Its maximum stress of 3 × 10⁶ Pa is greater than the maximum stress that X could withstand (2 × 10⁶ Pa).
(a) This china plate is brittle. It has not deformed at all. (b) The stress–strain graph for the plate shows that it exhibited no plastic behaviour. Its maximum stress (strength) was also its elastic limit. It is important to note that brittle materials are not necessarily weak. For example, some ceramics, which are brittle materials, can have enormous strength. The ceramic tiles used on the space shuttle have a breaking stress much greater than that of most metals.
Metals such as copper are ductile. This means that they can be drawn into wires. As the copper wire is stretched beyond its elastic limit, one section will narrow and become a weak point. This deformation is called necking. The stress–strain curve for a ductile material shows a large plastic region. The stress at which the copper wire fails is well below the maximum stress that it has withstood. Gold is the most ductile metal. A piece of gold about the size of a small book could be beaten so thin that it could cover a soccer field.
The area under the stress–strain graph is the strain energy per unit volume (J m–3) of the material. If the area is an irregular shape, a counting squares technique may be used to estimate its value.