Download
1 / 33
370 likes | 637 Views
Labor vulnerability , Income Volatility and Coverage of the Bolsa Familia Program Río de Janeiro, November 2010. BOLSA FAMILIA PROGRAM. Bolsa Familia in August 2010. 5,565 municipalities. 12,740,644 beneficiary families. R$ 1,212,200,292.00 in benefits (US$ 708,889,060.00)

E N D
Labor vulnerability, Income Volatility and Coverage of the Bolsa Familia ProgramRío de Janeiro, November 2010
Bolsa Familia in August 2010 5,565 municipalities 12,740,644 beneficiary families R$ 1,212,200,292.00 in benefits (US$ 708,889,060.00) Benefit average value: R$ 95 (US$ 56) US$ 1 = R$ 1.71
Bolsa Familia Program : Benefit Breakdown Benefit Range: R$ 22 (US$ 13) to R$ 200 (US$ 117)
Bolsa Familia Program: Evolution * Resources foreseen for 2010 Beneficiary Families and Financial Execution
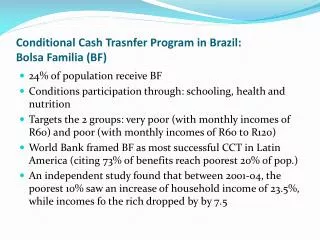
Target Population: Bolsa Familia Program and Unified Registry • Unified Registry • Target Population: families with per capita income of 1/2 the minimum salary (R$ 255,00 - US$ 149) or with total family income of up to 3 minimum salaries (R$ 1.530,00 - US$ 895).In the Unified Registry there are approximately 20 million families, of which 12.7 million are enrolled in Bolsa Familia. • Bolsa Familia Program • Target Population: families with per capita income of up to R$ 140 (US$ 82). Families with per capita income of up to R$ 70 (US$ 41) receive an additional basic benefit in addition to the variable benefits (associated to the presence of children and youth). Families with per capita income greater than R$ 70 and up to R$ 140 receive variable benefits only.
MECHANISMS TO ENSURE COVERAGE OF THE POOR Geographic targeting at two levels: Municipal Targeting The federal government allocates coverage quotas for the municipalities according to poverty estimates at the municipal level The municipalities can use complementary data on poverty, vulnerability and life conditions of the population in order to identify regions where there is a concentration of poor families
Targeting by Home Address • To determine eligibility of families for the Program tests are used to measure the resource /income level. • Families are screened in a centralized and automated way, based on the Unified Registry data according to the Program requirements. • Municipalities that have lower coverage of poor families and lower per capita income have higher chances of having families selected • In the monthly generation of the pay sheet, new families can be selected for the Program replacing those that will be cancelled MECHANISMS TO ENSURE COVERAGE OF THE POOR
Cancelled Benefits since 2003 Dropping out of the Bolsa FamiliaProgram
Evolution of Bolsa Familia Targeting Strategies • Correction of income eligibility criteria • Based on the variation of the National Consumer Price Index (INPC) from April 2006 to December 2008 • From R$ 120 / 60 to R$ 140 / 70 (US$ 82 / 41) • New estimates of the magnitude of the Bolsa Familia target population • Census 2000 +PNAD 2006 + Income Volatility Index • Definition of municipal estimates - Bolsa Familia target population • Poverty Maps Methodology
Income Volatility of the Most Vulnerable Families • A study made by IPEA (Soares et al, 2008) with data from Monthly Employment Research (PME) found that the families with a Bolsa Familia income profile have high levels of income volatility • Income volatility is explained by the exclusion of the poorest families from the formal labor market • The poorest families fluctuate constantly between being above or below the Bolsa Familia income threshold • This results in underestimating the magnitude of the Bolsa Familia target population, and there are variations of 18% (considering three months of family income) and up to 60% (considering 12 months of family income) • It was decided to adjust the magnitude of the Bolsa Familia target population using a volatility index of 18%: thus, 12,9 million poor families should be served in 2009-2010
The Challenge of Poverty Estimation in the Municipalities • Definition of the Bolsa Familia target population estimations in the municipalities: the Poverty Maps methodology • Problems with the municipal poverty estimates until 2006 • Highly associated with the estimations by the states • Did not take into consideration other variables different from demographic behavior • What is attained with the Poverty Map methodology • Developed by World Bank experts and adapted by the National Institute of Geography and Statistics (IBGE) • Permits adjusting the municipal estimates by using indicators from the administrative databases or studies on local economies • Permits establishing confidence intervals for poor family estimates in the municipalities • Based on the 2000 Census and the 2006 PNAD
Applying the Poverty Maps • Trends in Bolsa Familia coverage • Increase of nearly 2 million families served by the Program as compared to February 2009 (close to 18%) • Increased participation of the beneficiaries from the South, Central-West, and Southeast regions and from urban and metropolitan areas • Larger increase in the municipalities with over 500 thousand inhabitants (close to 32%) in comparison with the municipalities with fewer inhabitants (less than 10% in median terms).
Beneficiary Profile • In October 2009, the Bolsa Familia Program had 12.4 million families with a total of 49.2 million people; • Of this total number of beneficiaries, about 26.5 million were women (54% of the total) and 22.6 million were men (46% of the total); • Predominance of mulattos(64.1% of the total);
Beneficiary Profile • Low educational level of adult population (25 years or older), of which 16.7% are illiterate and 65.4% have incomplete basic education; • Between 2007 and 2009, the share of illiterate heads of beneficiary families went from 17.3% to 13.1%. • During the same period, the heads of the families with complete or incomplete basic education went from 13.2% to 17.6%;
Bolsa Familia’s TypicalFamily • Resides in the cities of the Northeast Region • Composed of 4 members • Receives a monthly per capita income of R$ 44.50 (US$22.25) • The head of household is a 37-year old mulatto woman who has not completed basic education • Owns their house in an urban area • Was registered and joined the program in 2006 • The children go to public schools and are educationally challenged • Head of autonomous family who does not make contributions to social security • 2/3 of the beneficiaries between 6 and 65 years of age are not working; 3 out of 10 adult beneficiaries are related to the formal and informal labor market • Receives a basic benefit and two variable benefits (R$ 102.00) or (US$ 51.00)
Share of the Population in the Unified Registry that is in the Formal Labor Market
Share of the Population in the Unified Registry that is in the Formal Labor Market
Share of the Population in the Unified Registry that is in the Formal Labor Market
Share of the Population in the Unified Registry that is in the Formal Labor Market
Beneficiaries’Labor Precariousness • Only 10% of the beneficiaries of the Bolsa Familia Program had participated in the formal labor market in 2007. This share is growing, but it continues to be small. • Turn-over rates among beneficiaries of the Bolsa Familia Program are greater than those found for Program non-beneficiaries. • The permanence period in formal employment is relatively short for beneficiaries. On average, beneficiaries stay employed in the formal market for only 11 months. • When beneficiaries lose their jobs, they find it difficult to go back to the formal market. Only 30% return to formality after 48 months. • In conclusion, Bolsa Familia Program beneficiaries currently have a better situation in the formal labor market, but their conditions continue to be precarious. • Source: Soares and Leichsenring. “Precariedade Laboral, Volatilidade de Renda e a Cobertura do Programa Bolsa Família”. Working Paper of the ‘Latin America and the Caribbean without Hunger Initiative’. FAO.
Tel: 55 61 3433-1500 THANK YOU