Download

1 / 45
450 likes | 550 Views
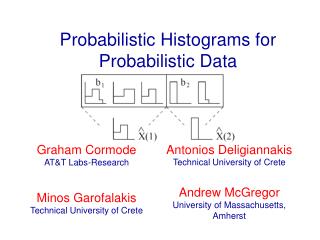
Probabilistic Prediction. Uncertainty in Forecasting. All of the model forecasts I have talked about reflect a deterministic approach.

E N D
Uncertainty in Forecasting • All of the model forecasts I have talked about reflect a deterministic approach. • This means that we do the best job we can for a single forecast and do not consider uncertainties in the model, initial conditions, or the very nature of the atmosphere. These uncertainties are often very significant. • Traditionally, this has been the way forecasting has been done, but that is changing now.
A Fundamental Issue • The work of Lorenz (1963, 1965, 1968) demonstrated that the atmosphere is a chaotic system, in which small differences in the initialization, well within observational error, can have large impacts on the forecasts, particularly for longer forecasts. • In a series of experiments found that small errors in initial conditions can grow so that all deterministic forecast skill is lost at about two weeks.
Butterfly Effect: a small change at one place in a complex system can have large effects elsewhere
Uncertainty Extends Beyond Initial Conditions • Also uncertainty in our model physics. • And further uncertainty produced by our numerical methods.
Probabilistic NWP • To deal with forecast uncertainty, Epstein (1969) suggested stochastic-dynamic forecasting, in which forecast errors are explicitly considered during model integration. • Essentially uncertainty estimates were added to each term in the primitive equation. • This stochastic method was not computationally practical.
Probabilistic-Ensemble NWP • Another approach, ensemble prediction, was proposed by Leith (1974), who suggested that prediction centers run a collection (ensemble) of forecasts, each starting from a different initial state. • The variations in the resulting forecasts could be used to estimate the uncertainty of the prediction. • But even the ensemble approach was not possible at this time due to limited computer resources. • Became practical in the late 1980s as computer power increased.
Ensemble Prediction • Can use ensembles to estimate the probabilities that some weather feature will occur. • The ensemble mean is more accurate on average than any individual ensemble member. • Forecast skill of the ensemble mean is related to the spread of the ensembles • When ensemble forecasts are similar, ensemble mean skill is higher. • When forecasts differ greatly, ensemble mean forecast skill is less.
A critical issue is the development of ensemble systems that provide probabilistic guidance that is both reliable and sharp.
Elements of a Good Probability Forecast • Reliability (also known as calibration) • A probability forecast p, ought to verify with relative frequency p. • Forecasts from climatology are reliable (by definition), so calibration alone is not enough.
Elements of a Good Probability Forecast • Sharpness (a.k.a. resolution) • The variance or confidence interval of the predicted distribution should be as small as possible. Probability Density Function (PDF) for some forecast quantity Sharp Less Sharp
Early Forecasting Started Probabilistically • Early forecasters, faced with large gaps in their nascent science, understood the uncertain nature of the weather prediction process and were comfortable with a probabilistic approach to forecasting. • Cleveland Abbe, who organized the first forecast group in the United States as part of the U.S. Signal Corp, did not use the term “forecast” for his first prediction in 1871, but rather used the term “probabilities,” resulting in him being known as “Old Probabilities” or “Old Probs” to the public. • A few years later, the term ‘‘indications’’ was substituted for probabilities and by 1889 the term ‘‘forecasts’’ received official sanction (Murphy 1997).
“Ol Probs” • Cleveland Abbe (“Ol’ Probabilities”), who led the establishment of a weather forecasting division within the U.S. Army Signal Corps, • Produced the first known communication of a weather probability to users and the public. Professor Cleveland Abbe, who issued the first public “Weather Synopsis and Probabilities” on February 19, 1871
History of Probabilistic Prediction • The first operational probabilistic forecasts in the United States were produced in 1965. These forecasts, for the probability of precipitation, were produced by human weather forecasters and thus were subjective predictions. The first objective probabilistic forecasts were produced as part of the Model Output Statistics (MOS) system that began in 1969.
Ensemble Prediction • Ensemble prediction began an NCEP in the early 1990s. ECMWF rapidly joined the club. • During the past decades the size and sophistication of the NCEP and ECMWF ensemble systems have grown considerably, with the medium-range, global ensemble system becoming an integral tool for many forecasters. • Also during this period, NCEP has constructed a higher resolution, short-range ensemble system (SREF) that uses breeding to create initial condition variations.
NCEP Global Ensemble System • Begun in 1993 with the MRF (now GFS) • First tried “lagged” ensembles as basis…using runs of various initializations verifying at the same time. • For the last ten years have used the “breeding” method to find perturbations to the initial conditions of each ensemble members. • Breeding adds random perturbations to an initial state, let them grow, then reduce amplitude down to a small level, lets them grow again, etc. • Give an idea of what type of perturbations are growing rapidly in the period BEFORE the forecast. • Does not include physics uncertainty. • Coarse spatial resolution..only for synoptic features.
NCEP Global Ensemble At 00Z: • T254L64 high resolution control) out to 7 days, after which this run gets truncated and is run out to 16 days at a T170L42 resolution • T62 control that is started with a truncated T170 analysis • 10 perturbed forecasts each run at T62 horizontal resolution. The perturbations are from five independent breeding cycle. At 12Z: • T254L64 control out to 3 days that gets truncated and run at T170L42 resolution out to 16 days • Two pairs of perturbed forecasts based on two independent breeding cycles (four perturbed integrations out to 16 days.
An analysis produced to run a model like the eta is in the neighborhood of truth. The complete error vector is unknown, but we have some idea of its structure and magnitude. T T 48h forecast 12h forecast 24h forecast 36h forecast e Chaos drives apart the forecast and true trajectories…predictability error growth. EF can predicted the error magnitude and give a “probabilistic cloud” of forecasts. The true state of the atmosphere exists as a single point in phase space that we never know exactly. 48h verification A point in phase space completely describes an instantaneous state of the atmosphere. For a model, a point is the vector of values for all parameters (pres, temp, etc.) at all grid points at one time. phase space
T T M 12h forecast 24h forecast 36h forecast e a c u j n g Analysis Region t phase space 48h forecast Region
Verification The Thanksgiving Forecast 2001 42h forecast (valid Thu 10AM) SLP and winds • Reveals high uncertainty in storm track and intensity • Indicates low probability of Puget Sound wind event 1: cent 5: ngps 11: ngps* 8: eta* 2: eta 3: ukmo 6: cmcg 9: ukmo* 12: cmcg* 4: tcwb 7: avn 13: avn* 10: tcwb*
Box and whiskers
Major Global Ensembles • NCEP GEFS (Global Ensemble Forecasting System): GFS, 21 members every 6 hr, T190 (roughly 84 km resolution), 28 levels http://www.esrl.noaa.gov/psd/map/images/ens/ens.html) • Canadian CEFS: GEM Model, 21 members, 100 km grid spacing, 0 and 12Z • ECMWF: 51 members, 62 levels, 0 and 12Z, T399 (roughly 50 km)
Major International Global/Continental Ensembles Systems • North American Ensemble Forecasting Systems (NAEFS): Combines Canadian and U.S. Global Ensembles: http://www.meteo.gc.ca/ensemble/naefs/EPSgrams_e.html
NCEP Short-Range Ensembles (SREF) • Resolution of 32 km • Out to 87 h twice a day (09 and 21 UTC initialization) • Uses both initial condition uncertainty (breeding) and physics uncertainty. • Uses the Eta and Regional Spectral Models and recently the WRF model (21 total members) • http://www.emc.ncep.noaa.gov/SREF/
British Met Office MOGREPS • 24 members, 18 km
SREF Current System Model Res (km) Levels Members Cloud Physics Convection RSM-SAS 45 28 Ctl,n,p GFS physics Simple Arak-Schubert RSM-RAS 45 28 n,p GFS physics Relaxed Arak-Schubert Eta-BMJ 32 60 Ctl,n,p Op Ferrier Betts-Miller-Janjic Eta-SAT 32 60 n,p Op Ferrier BMJ-moist prof Eta-KF 32 60 Ctl,n,p Op Ferrier Kain-Fritsch Eta-KFD 32 60 n,p Op Ferrier Kain-Fritsch with enhanced detrainment PLUS * NMM-WRF control and 1 pert. Pair * ARW-WRF control and 1 pert. pair
Ensemble Post-Processing • Ensemble output can be post-processed to get better probabilistic predictions • Can weight better ensemble members more. • Correct biases • Improve the width of probabilistic distributions (pdfs)
There is a whole theory on using probabilistic information for economic savings C= cost of protection L= loss if bad event event occurs Decision theory says you should protect if the probability of occurrence is greater than C/L
Optimal Threshold = 15% Decision Theory Example Forecast? YES NO Critical Event: sfc winds > 50kt Cost (of protecting): $150K Loss (if damage ): $1M Hit False Alarm Miss Correct Rejection YES NO $150K $1000K Observed? $150K $0K
Deterministic Nature? • People seem to prefer deterministic products: “tell me exactly what is going to happen” • People complain they find probabilistic information confusing. Many don’t understand POP. • Media and internet not moving forward very quickly on this.
Even worse…they use the same icons for likely rain and rain as they do for chance rain. Also, they used “likely rain” for 70% on this page and “chance rain” for 70% in the example on the previous page
And a “slight” chance of freezing drizzle reminds one of a trip to Antarctica
A great deal of research and development is required to develop effective approaches for communicating probabilistic forecasts which will not overwhelm people and allow them to get value out of them.