Download
1 / 63
640 likes | 1.09k Views
Nutritional Disorders in Turkey and in the World. Prof.Dr.Selma KARABEY. Nutritional Disorders. Micronutrient malnutrition Iron deficiency Iodine deficiency Vitamin A deficiency Folate deficiency Protein energy malnutrition Kawashiorkor diseasese , Marasmus ( or wasting ).

E N D
NutritionalDisorders in Turkeyand in the World Prof.Dr.Selma KARABEY
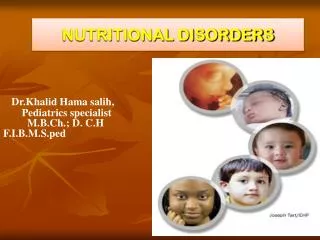
NutritionalDisorders Micronutrientmalnutrition • Irondeficiency • Iodinedeficiency • Vitamin A deficiency • Folatedeficiency Protein energymalnutrition • Kawashiorkordiseasese, • Marasmus( orwasting)
NutritionalDisorders-2 Chronicnon-communicablediseasesassociatedwithdietandnutrition: • Coronaryhearthdisease • Hypertansionandstroke • Cancers • Obesity • Non-insulindependentdiabetesmellitus • Dentalcaries
Terminology • Stunting(inadequate length/height for age) captures early chronic exposure to undernutrition; • Wasting(inadequate weight for height) captures acute undernutrition; • Underweight(inadequate weight for age) is a composite indicator that includes elements of stunting and wasting.
Terminology-2 • Severe acute malnutrition :is defined as the percentage of children aged 6 to 59 months whose weight for height is below minus three standard deviations from the median of the WHO Child Growth Standards, or by a mid-upper-arm circumference less than 115 mm, with or without nutritional oedema. • Overweight :is defined as the percentage of children aged 0 to 59 months whose weight for height is above two standard deviations (overweight and obese) or above three standard deviations (obese) from the median of the WHO Child Growth Standards. • Low birthweight:is defined as a weight of less than 2,500 grams at birth.
ChronicMalnutrition:Stunting • Chronic malnutrition, or stunting, is another form of growth failure. Chronic malnutrition occurs over time, unlike acute malnutrition. • A child who is stunted or chronically malnourished often appears to be normally proportioned but is actually shorter than normal for his/her age. • Stunting starts before birth and is caused by poor maternal nutrition, poor feeding practices, poor food quality as well as frequent infections which can slow down growth.
ChronicMalnutrition:Stunting • Stunting is estimated by the United Nations Children’s Fund (UNICEF) to affect 800 million people world wide. • 195 million children under 5 years of ages are stunted. 85% of the worlds stunted children live in 20 countries. • But this burden is not evenly distributed around the world. Sub-Saharan Africa and South Asia are home to three fourths of the world’s stunted children. • In sub-Saharan Africa, 40 per cent of children under 5 years of age are stunted; in South Asia, 39 per cent are stunted. • The World Health Assemblyhas adopted a new target of reducingthe number of stunted children under the age of 5 by 40 per cent by 2025.
Stunting in Turkey • InTurkey, 1/10 of childrenunder 5 yearsoldarestuntedandmorethan 1/3 of themareseverlystunted.(TNSA 2008) • % 12 of 24-59 monthschildrenarestunted. • Severlystunting is morecommen in theagegroup of 24-35 months. • % 3 of 48-59 monthschildrenareseverlystunted. • Inthe6-10 yearsoldschoolagegroup, % 5 of themstuntedand% 21.5 of themshort.(TOÇBİ 2011)
AcuteMalnutrition:Wasting • Globally in 2011, 52 million children under 5 years of age were moderately or severely wasted, an 11 per cent decrease from the estimated figure of 58 million in 1990. More than 29 million children under 5, an estimated 5 per cent, suffered from severe wasting. • InTurkey, 4 percent of 24-35 monthschildrenandlowerthan 2 percentof 48 anduppermonthschildrenareunderweight. • 8 percent (in urban areas)or9 percent (in rural) of 0-59 monthschildrenarewasted. (TNSA 2008)
Clinical Forms of AcutMalnutrition There are 3 clinical forms of acute malnutrition: • Marasmus – severe weight loss or wasting • Kwashiorkor– bloated appearance due to water retention (bi-lateral oedema). • Marasmic-kwashiorkor– a combination of both wasting and bi-lateral oedema.
AcuteMalnutrition : Marasmus(OrWasting) • A rapid deterioration in nutritional status in a short time can lead to marasmus, one form of acute malnutrition. • Marasmus is the most common form of acute malnutrition in nutritional emergencies and, in its severe form, can very quickly lead to death if untreated. • It is characterised by severe wasting of fat and muscle which the body breaks down to make energy. • Wasting can affect both children and adults.
AcuteMalnutrition : Marasmus(OrWasting) • The body of a wasted child tries to conserve energy as much as possible by reducing physical activity and growth, reducing internal body processes and shutting down the body’s response to infection. • This reduced activity results in limited function of the liver, kidney, heart and gut putting the child at risk for: • Lowbloodsugar (hypoglisemia) • Low body temparature (hypothermia) • Fluidoverlood/heartfailure • Infection
AcuteMalnutrition : Marasmus(OrWasting) Typical characteristics of a wasted childinclude: • ‘Skin andbones’ apperance • A thin ‘old man’ face • Ribsandshoulderboneseasily seen, skin of upper arms loose, skin of thighs loose,flesh missing from buttocks resulting in loose skin • Usually active and may appear to be alert
AcuteMalnutrition : Marasmus(OrWasting) • A wasted child can be classified as either moderately or severely acutely malnourished based on body measurements. • Mid-Upper Arm Circumference (MUAC) and Weight-for-Height Z-score (WHZ) are the indicators used to classify a child with wasting.
AcuteMalnutrition:Kwashiorkor(orbi-lateralpittingoedema) • Kwashiorkor is characterised by bilateral pitting oedema (affecting both sides of the body) in the lower legs and feet which as it progresses becomes more generalised to the arms, hands and face. • Oedemais the excessive accumulation of fluid in body tissues which results from severe nutritional deficiencies. • All cases of kwashiorkor are classified as severe acute malnutrition.
AcuteMalnutrition:Kwashiorkor(orbi-lateralpittingoedema) Kwashiorkor is classified by the severity of the oedema, as follows: • + Mild: bothfeet • ++ Moderate: both feet, plus lower legs, hands or lower arms • +++ Severe: generalized oedema including both feet, legs, hands, arms and face.
AcuteMalnutrition:Kwashiorkor(orbi-lateralpittingoedema) Clinical signs of kwashiorkor include: • Loss of appetite • Apathyandirritability • Changes in hair colour (yellow/orange) • Dermatosis Dermatosisis common in children with oedema. Signs of dermatosis include: • Patches of skin abnormally light or dark • Shedding of skin, ulceration of skin and/or weeping lesions
AcuteMalnutrition:Marasmic-Kwashiorcor(Combinedwastingandbi-lateralpittingoedema)AcuteMalnutrition:Marasmic-Kwashiorcor(Combinedwastingandbi-lateralpittingoedema) • Marasmic-kwashiorkor is a mixed form of both marasmus and kwashiorkor and is characterized by the presence of both wasting and bilateral pitting oedema. • Both Kwashiorkor and Marasmic-kwashiorkor are very serious conditions and are classified as forms of severe acute malnutrition.
AdultUndernutrition • Adultswith a BMI ˂18.5 areconsideredto be chronicallyundernourishedwhilethosewithBMI˃25 and˃30 areconsideredoverweightandobeseandthesamecutoffsapplybothmalesandfemales. • Thenumber of undernourishedestimated is 854 million of which 820 millionare in devolopingcountries.(2006 FAO)
AdultOverweightandObesity • 1/3 Adults(%34 of men,%35 of women)owerweight― BMI ≥ 25 kg/m2 • 1/10 men (%10) andmorethanone in 10 women(%14) obese― BMI ≥ 30 kg/m2 • IntheRegion of the Americas, followed by the EuropeanRegion, more than 50% of the adult population were overweight and more than 20% wereobese. • Adultoverweightandobesity was much more prevalent in upper middle-income and high-income groups thanin lower middle-income and low-income groups. • Obesity was more common in womenthanin men.
Nutrition-specificinterventions • The 2009 Tracking Progress on Child and Maternal Nutrition report summarized the evidence base for nutrition-specific interventions. Taking a life-cycle approach, the activities fall broadly into the following categories: • Maternal nutrition and prevention of low birthweight • Infant and young child feeding (IYCF) Breastfeeding, with early initiation (within one hour of birth) and continued exclusive breastfeeding for the first six months followed by continued breastfeeding up to 2 years • Safe, timely, adequate and appropriate complementary feeding from 6 months onwards • Prevention and treatment of micronutrient deficiencies • Prevention and treatment of severe acute malnutrition • Promotion of good sanitation practices and access to clean drinking water • Promotion of healthy practices and appropriate use of health services
Irondeficiencyandanaemia • Iron deficiency is the most common nutritional deficiency, with more than 2 billion peopleaffected worldwide (WHO, 2001). • Globally, anaemia affects 1.62 billion people, or 24.8%of the world’s population.Anaemia in preschool-age children and in women is a severepublic health problem, with a prevalence of at least 40%, in most countries in the AfricanRegion and the South-East Asia Region, and in parts of Latin America (WHO & CDC, 2008)
Irondeficiencyandanaemia • The highest prevalence of anaemia is found among preschool-age children (47.4%),and the lowest prevalence is among men (12.7%). • The population group in which thelargest number of individuals affected is non-pregnant women (468.4 million). The AfricanRegion has the highest rates of all the regions, with anaemia affecting two out of threepreschool-age children (67.6%), and about every second pregnant (57.1%) and nonpregnant(47.5%) woman. • The largest numbers are in the South-East Asia Region, where315 million individuals in these three population groups are affected (WHO & CDC,2008).
Vitamin A deficiency • Globally, one in three preschool-aged children and one in six pregnant women are deficient in vitamin A due to inadequate dietary intake (1995–2005 data). • The highest prevalence remains in Africa and South- East Asia. • Vitamin A is necessary to support immune system response, and children who are deficient face a higher risk of dying from infectious diseases such as measles and diarrhoea
Vitamin A deficiency-2 • Vitamin A deficiency (VAD) is the leading cause of preventable blindness in children and increases the risk of disease and death from severe infections. In pregnant women VAD causes night blindness and may increase the risk of maternal mortality • An estimated 250 million preschool children are vitamin A deficient and it is likely that in vitamin A deficient areas a substantial proportion of pregnant women is vitamin A deficient._Globally, one in three preschool-aged children and one in six pregnant women are deficient in vitamin A due to inadequate dietary intake (1995–2005 data).
Iodinedeficiency • Iodine deficiency is the most common cause of preventable mental impairment. Fortification of salt is widely used to avert consequences associated with this deficiency. • Significant progress has been made in reducing the number of countries whose populations suffer mild to severe iodine deficiency, from 54 countries in 2003 to 32 in 2011. • During this period the number of countries reaching adequate iodine intake increased by more than one third, from 43 to 69.