Download
1 / 62
620 likes | 782 Views
Gridded LAMP Pre-implementation Briefing. Judy Ghirardelli National Weather Service Meteorological Development Laboratory. June 14, 2011. Outline. LAMP background Gridded LAMP details and available products Gridded verification ( Temperature, Dewpoint)

E N D
Gridded LAMP Pre-implementation Briefing Judy Ghirardelli National Weather Service Meteorological Development Laboratory June 14, 2011
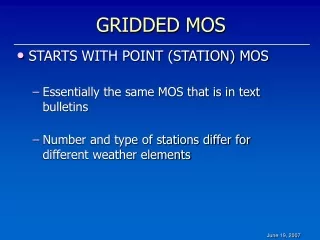
Outline • LAMP background • Gridded LAMP details and available products • Gridded verification (Temperature, Dewpoint) • Station verification (Ceiling Height, Visibility) • User feedback
Localized Aviation MOS Program (LAMP) Background LAMP is a statistical guidance system providing guidance for sensible weather elements LAMP acts as an update to GFS MOS guidance; LAMP bridges the gap between the observations and the MOS forecast LAMP provides guidance for aviation elements 2006-2008: Implemented LAMP at stations and gridded thunderstorm guidance 2010: Implemented experimental version of Gridded LAMP
Gridded LAMP Details • Gridded observations and LAMP forecasts of: • Temperature • Dewpoint • Ceiling Height (100’s of ft) • Visibility (miles) • Other elements later • Status: • Running experimentally at NCEP as of 9/28/2010 • Data available in Experimental NDGD • Available in MDL’s test Web Coverage Service • Exp. GLMP grids can be brought into AWIPS via the LDM data feed • 60-day public comment period (Nov – Dec 2010) • Images available on LAMP web page • Will be available via the NextGen 4-D Data Cube
Gridded LAMP Details • Gridded LAMP analyses of observations – for checkout and verification • Temperature and Dewpoint: • Observations from METAR, Mesonet, synoptic stations, C-MAN, tide gauges, and moored buoys (Roughly 10,000 – 12,000 observations per hour) • Error estimates of temperature and dewpoint available in gridded format • Ceiling and Visibility: • Observations from METAR • Gridded Analysis of LAMP forecasts • Temperature and dewpoint: continuous values are analyzed • Ceiling Ht and Vis: categorical values are converted to continuous valuesTechnique: MDL Gridding Technique used in Gridded MOS, with modifications
Temperature Dewpoint Ceiling Height Visibility Gridded Observations
Temperature Error Estimate Dewpoint Error Estimate Observation Analysis Error Estimates Error Estimate: “a measure of the inability to recover the data values on which the analysis is based from the gridded analysis by linear interpolation anywhere within the extent of the grid.” (Glahn and Im, 2010) Error Estimate: “a measure of the inability to recover the data values on which the analysis is based from the gridded analysis by linear interpolation anywhere within the extent of the grid.” (Glahn and Im, 2010)
Gridded LAMP Work: Gridded Observations Ceiling Height Observations Visibility Observations Visibility
Gridded LAMP Work: Gridded Forecasts Ceiling Ht Forecasts 1-25 hours Visibility Forecasts 1-25 hours
Gridded LAMP Verification Ceiling Height and Visibility: Gridded LAMP values interpolated to stations, verification at LAMP stations and off-LAMP stations Temperature and Dew Point: Gridded LAMP values compared against Gridded MOS values • Data Sample: November-December 2010 • Area: CONUS, 2.5-km grid
Gridded LAMP Verification Study: Gridded Verification • Compared GLMP vs. GMOS • 0600 UTC GLMP vs 0000 UTC GMOS • 1800 UTC GLMP vs 1200 UTC GMOS • Data Sample: November-December 2010 • Area: CONUS, 2.5-km grid • Variables: Temperature and Dew Point • Verifications using two methods: • GLMP 00-hr gridded observations • RTMA
Gridded LAMP Verification Study: Summary Verified with LAMP Gridded Observations Verified with RTMA * Early refers to the 3- and 6-hour projections ** Late refers to the 9-, 12-, 15-, 18-, 21- and 24-hour projections
Gridded Verification Verifying Obs: Gridded LAMP obs 0600 UTC GLMP – 03 HR Projection Temperature – Verified w/ gridded obs 0600 UTC GLMP – 03 HR Projection Temperature – Verified w/ RTMA
Gridded Verification Verifying Obs: Gridded LAMP obs 1800 UTC GLMP – 03 HR Projection Temperature – Verified w/ gridded obs 1800 UTC GLMP – 03 HR Projection Temperature – Verified w/ RTMA
Gridded Verification Verifying Obs: Gridded LAMP obs 0600 UTC GLMP – 03 HR Projection Dewpoint – Verified w/ gridded obs 0600 UTC GLMP – 03 HR Projection Dewpoint – Verified w/ RTMA
Gridded Verification Verifying Obs: Gridded LAMP obs 1800 UTC GLMP – 03 HR Projection Dewpoint – Verified w/ gridded obs 1800 UTC GLMP – 03 HR Projection Dewpoint – Verified w/ RTMA
GLMP T and Td Gridded Verification Summary • Overall, GLMP shows improvement over GMOS, as expected • Result independent of verifying data (GLMP gridded obs or RTMA) • By gridpoint, GMOS temperature is better than GLMP temperature in Western Region for some gridpoints, some projections • Potential solution developed and soon to be tested. Would be implemented in FY12.
Gridded LAMP Verification Study: Station Verification • No Gridded ceiling/visibility verifying observations other than from Gridded LAMP • Verifying at stations • At LAMP stations • At non-LAMP stations
GLMP verified at stations • Meteorological Variables and Scoring Method: Threat Scores for Ceiling (< 500’, < 1,000’ and ≤ 3,000’) Threat Scores for Visibility (< 1 miles, < 3 miles) • Two cycle times (0600 UTC and 1800 UTC) • Verified for Nov-Dec, 2010 • Two types of plots: • First, with GLMP and LAMP (station) verified • 300 CONUS LAMP sites used in the verification • GLMP interpolated to LAMP station sites verified against the METARsvs.Actual LAMP station data verified against the METARs • Purpose: to see if GLMP interpolated to the stations is as good as actual LAMP at the stations. • Second, GLMP interpolated to non-LAMP stations • Mimics with-held data testing • 115 stations where LAMP station forecasts were not available, but observations were • Used to examine the accuracy of GLMP alone • Verification Dataset: GLMP compared to LAMP stations (at current LAMP stations) LAMP at LAMP stations GLMP interpolated to non-LAMP stations
Verified at current LAMP stations (300) Verified at non-LAMP stations (115)
Verified at current LAMP stations (300) Verified at non-LAMP stations (115)
Verified at current LAMP stations (300) Verified at non-LAMP stations (115)
Verified at current LAMP stations (300) Verified at non-LAMP stations (115)
GLMP Cig and Vis Station Verification Summary • Overall, GLMP interpolated to LAMP stations shows no degradation compared to LAMP guidance at stations, as expected • GLMP interpolated to non-LAMP stations potentially worse than GLMP interpolated to LAMP stations, as expected • More difficult to objectively quantify given small sample
User Comments • Public Notification Statement: • Released a Public Information Statement (PNS) requesting comments on the GLMP products for a 60-day comment period. • We collected data via surveys on the data (as required by the PNS) and the graphics (which we did not solicit comments for, and are not required to ask for, but we accept and consider). • In the 60-day comment period we received no responses about the data, and one response about the graphics (which was favorable). • As of February 2011, ER and WR had voted Gridded LAMP as their first priority in the Software Recommendation and Evaluation Committee (SREC)
User Comments • Initial Feedback from WFO Charleston (WV): • Favorable feedback • Specific comments included: • Visibility was not restricted to just the valleys - it was spread out to the mountains. While this is not realistic, they can easily correct it in the grids via AWIPS tools. • The temperatures resolution of the temperatures along the higher elevations is much better than what they had before, but they are still too warm by 4-5 degrees. • They questioned how the system will handle Cold Air Damming in the winter. This has not yet been assessed. Note regarding the temperature comment: We have a scheme for improving GLMP temperature and dewpoint forecasts in the future that is still to be tested.
User Comments • Recent (March 2011) Feedback from WFO Charleston (WV): • “The gridded LAMP has been a great improvement for use in GFE over the point data. Before the gridded LAMP we had to SERP in the point data which greatly smoothed over detail and removed, rather then adjusted, detail in the mountains.” • “Temperatures have shown a great improvement in the mountains. The "broader valleys" are picked up where they used to be wiped out. The higher elevations are also handled much better making it easy to "tweak" with tools.” • “Dew point detail is much improved as well, although there are still smoothing issues in the mountains.” • “The ceiling grids have shown a dramatic improvement over SERPing the point data. Resolution in the mountains is much improved. At times there is "to much" detail along the ridges as it appears to over compensate for terrain. With tools, this is easily addressed. “ • “Visibility grids for systems moving in and out have been an improvement over the point data for constructing our visibility grids. They are still noisy during fog situations.” • “With the resolution improvements as a result of grids, first guess fields are much improved assisting in the forecast creation process.”
User Comments • Feedback from WFO in Caribou, ME: • Small study of a station that was distant from stations that had ceiling height and visibility observations, and distant from LAMP stations that had ceiling height and visibility guidance. • The object of the study was to see how GLMP (observations and forecasts) verified away from data points by using a web camera as validation. • Their results were favorable.
User Comments • Feedback from the Boston WFO: • “So far the forecasters here like the Ceiling (PredHgt) and Vsby fields the best, especially in the first 6 hours. We have seen far fewer "bulls eyes" than we did with the point LAMP data.” • “We have also been looking at temperature and dew point from GLAMP. These fields are far less useful, as they are often way off base (even in the first few hours). Forecasters prefer to use the point LAMP (LAV) on a RUC background instead.”Note regarding the temperature and dewpoint comment: We have a scheme for improving GLMP temperature and dewpoint forecasts in the future that is still to be tested.
User Comments • Feedback from the Greenville-Spartenburg WFO: • Much of the feedback dealt with the fact that there was a problem in AWIPS that is thought to be a problem with the Graphical Forecast Editor ingesting the GLMP data, and not a problem with the raw GLMP grids themselves. Their feedback ends with “The LAMP25 Vsby grids have been an excellent guidance source for us.” • Feedback from the FAA: • In a meeting to discuss GLMP for ceiling height and visibility with the FAA on December 15, 2010 the FAA representatives indicated they were in favor of the GLMP ceiling height and visibility products, and they expressed an interest in using the products experimentally to assist with Helicopter Emergency Medical Service operations.