Download
1 / 20
280 likes | 629 Views
Sucrose/Water Phase Diagram. 10. 0. Solubility. L. Limit. 8. 0. (liquid). 6. 0. +. L. Temperature (°C). S. (liquid solution. 4. 0. i.e., syrup). (solid. 20. sugar). 0. 20. 40. 60. 80. 100. Co. =Composition (wt% sugar). Sugar. Water. Pure. Pure.

E N D
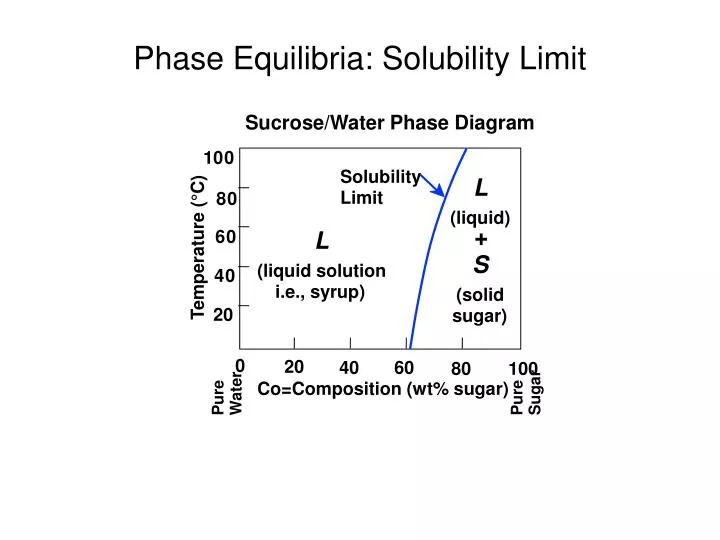
Sucrose/Water Phase Diagram 10 0 Solubility L Limit 8 0 (liquid) 6 0 + L Temperature (°C) S (liquid solution 4 0 i.e., syrup) (solid 20 sugar) 0 20 40 60 80 100 Co =Composition (wt% sugar) Sugar Water Pure Pure Phase Equilibria: Solubility Limit
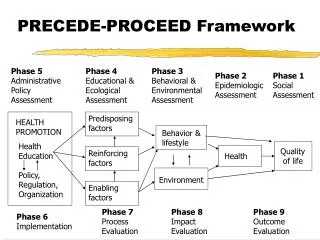
Components and Phases Aluminum- Copper Alloy b (lighter phase) a (darker phase)
100 L 80 (liquid) + water- sugar system 60 L S Temperature (°C) ( liquid solution (solid 40 i.e., syrup) sugar) 20 0 0 20 40 60 70 80 100 Co =Composition (wt% sugar) Effect of T & Composition (Co)
T(°C) 1600 • Phase Diagram for Cu-Ni system 1500 L (liquid) 1400 a liquidus + 1300 L solidus a 1200 (FCC solid 1100 solution) 1000 wt% Ni 0 20 40 60 80 100 Phase Diagrams
T(°C) 1600 L (liquid) 1500 Cu-Ni phase diagram liquidus 1400 solidus a a + 1300 L (FCC solid 1200 solution) 1100 1000 wt% Ni 0 20 40 60 80 100 Phase Diagrams:Number and types of phases
Cu-Ni system T(°C) liquidus L (liquid) 1300 a + L solidus a a + L (solid) 1200 20 30 40 50 wt% Ni Composition of phases
Weight fractions of phases Cu-Ni system T(°C) liquidus L (liquid) 1300 a + L solidus a a + L (solid) 1200 20 3 0 4 0 5 0 wt% Ni
T(°C) tie line liquidus L (liquid) 1300 a + L B T solidus B a a + L (solid) 1200 S R 20 3 0 4 0 5 0 C C C a L o wt% Ni The Lever Rule
Cooling in a Cu-Ni Binary T(°C) L (liquid) Cu-Ni system a 130 0 + L a + 120 0 L a (solid) 110 0 35 20 3 0 4 0 5 0 wt% Ni C o
60 %EL for pure Cu 400 %EL for 50 pure Ni TS for Elongation (%EL) 40 pure Ni Tensile Strength (MPa) 300 30 TS for pure Cu 200 20 0 20 40 60 80 100 0 20 40 60 80 100 Cu Ni Cu Ni Composition, wt% Ni Composition, wt% Ni Mechanical Properties:Cu-Ni System --Tensile strength (TS) --Ductility (%EL,%AR)
Binary-Eutectic Systems T(°C) Cu-Ag system 1200 L (liquid) 1000 a L + a b L + 779°C b 800 TE 8.0 71.9 91.2 600 a + b 400 200 80 100 0 20 40 60 CE Co , wt% Ag
Binary-Eutectic Systems T(°C) Cu-Ag system 1200 L (liquid) 1000 a L + a b L + 779°C b 800 TE 8.0 71.9 91.2 600 a + b 400 200 80 100 0 20 40 60 CE Co , wt% Ag
Binary-Eutectic Systems T(°C) Cu-Ag system 1200 L (liquid) 1000 a L + a b L + 779°C b 800 TE 8.0 71.9 91.2 600 a + b 400 200 80 100 0 20 40 60 CE Co , wt% Ag
Microstructures in Eutectic Systems: I T(°C) 400 L 300 L a + a 200 (Pb-Sn TE System) 100 b + a 0 10 20 30 Co , wt% Sn Co 2 (room T solubility limit)
Microstructures in Eutectic Systems: II T(°C) 400 L 300 L + a a 200 TE 100 b + a Pb-Sn system 0 10 20 30 Co , wt% Sn Co 2 (sol. limit at T ) 18.3 room (sol. limit at TE)
Microstructures in Eutectic Systems: III T(°C) 300 L Pb-Sn system a L + a b L 200 183°C TE 100 a 0 20 40 60 80 100 CE C, wt% Sn 61.9
Microstructures in Eutectic Systems: III Micrograph of Pb-Sn eutectic microstructure 160m
Microstructures in Eutectic Systems: IV T(°C) L: Co wt% Sn 300 L Pb-Sn system a L + a b b L + 200 TE a b 100 + 0 20 40 60 80 100 Co, wt% Sn