Download
1 / 32
340 likes | 372 Views
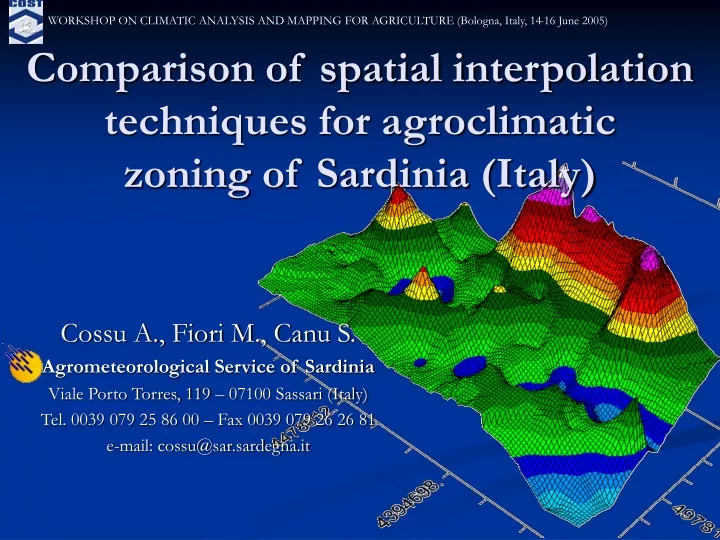
WORKSHOP ON CLIMATIC ANALYSIS AND MAPPING FOR AGRICULTURE (Bologna, Italy, 14-16 June 2005). Comparison of spatial interpolation techniques for agroclimatic zoning of Sardinia (Italy). Cossu A., Fiori M., Canu S. Agrometeorological Service of Sardinia

E N D
WORKSHOP ON CLIMATIC ANALYSIS AND MAPPING FOR AGRICULTURE (Bologna, Italy, 14-16 June 2005) Comparison of spatial interpolation techniques for agroclimaticzoning of Sardinia (Italy) Cossu A., Fiori M., Canu S. Agrometeorological Service of Sardinia Viale Porto Torres, 119 – 07100 Sassari (Italy) Tel. 0039 079 25 86 00 – Fax 0039 079 26 26 81 e-mail: cossu@sar.sardegna.it
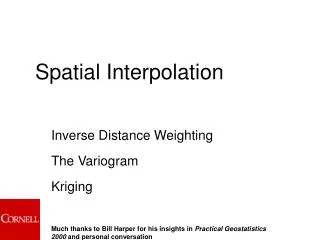
WORKSHOP ON CLIMATIC ANALYSIS AND MAPPING FOR AGRICULTURE (Bologna, Italy, 14-16 June 2005) Aims • Evaluate several methods for precipitation and temperature spatial interpolation in Sardinia • Integrate the interpolated information in SAR Geographic Information System • Using GIS for agroclimatic and ecosystems characterization of Sardinia
WORKSHOP ON CLIMATIC ANALYSIS AND MAPPING FOR AGRICULTURE (Bologna, Italy, 14-16 June 2005) Reference activity Experiences in COST 719 indicated the path that the authors have followed
WORKSHOP ON CLIMATIC ANALYSIS AND MAPPING FOR AGRICULTURE (Bologna, Italy, 14-16 June 2005) The GIS SAR GIS dataset is based on: SOIL information: land use, high resolution DEM (20 mt), ecopedological data WEATHER information: climatic data for 250 thermopluviometric stations for a 50 years period. agrometeorological data with high temporal resolution for 60 stations from 1995. SATELLITE information: NOAA and LANDSAT images.
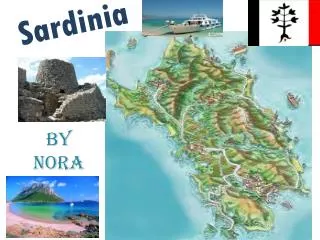
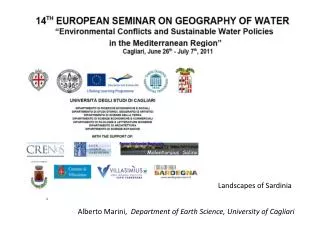
WORKSHOP ON CLIMATIC ANALYSIS AND MAPPING FOR AGRICULTURE (Bologna, Italy, 14-16 June 2005) A few information about Sardinia • Sardinia is the second Mediterranean island, with approximately 2.5 million hectares with 1.6 million people. • Sardinia is an ancient island and the long erosion processes caused the absence of high mountains. The territory is characterized above all by extended plateaus with elevation ranges between 300 and 1.000 meters. • The intensive agricultural areas are localized in the plains of west coast, but the widest hilly areas are interested by vineyards (36000 ha), olive groves (40000 ha) and intensive livestock breeding (1.5 million hectares with 3.5 million ewes).
WORKSHOP ON CLIMATIC ANALYSIS AND MAPPING FOR AGRICULTURE (Bologna, Italy, 14-16 June 2005) The Sardinian Environment A typical Agricultural Ecosystem in plain coast areas
WORKSHOP ON CLIMATIC ANALYSIS AND MAPPING FOR AGRICULTURE (Bologna, Italy, 14-16 June 2005) The Sardinian Environment Husbandry Ecosystem in hilly areas
WORKSHOP ON CLIMATIC ANALYSIS AND MAPPING FOR AGRICULTURE (Bologna, Italy, 14-16 June 2005) The Sardinian Environment Natural Ecosystem in mountain areas
WORKSHOP ON CLIMATIC ANALYSIS AND MAPPING FOR AGRICULTURE (Bologna, Italy, 14-16 June 2005) Sardinian climate patterns The sea around the island is a source of climatic variation determining a coast-inland pattern. The latitudinal development of island (approximately 200 km) gives a climatic North-South pattern. The elevation is particularly important on the east coast where steep mountains near the sea trigger East-West autumn precipitation pattern.
WORKSHOP ON CLIMATIC ANALYSIS AND MAPPING FOR AGRICULTURE (Bologna, Italy, 14-16 June 2005) Data and Methods • 59 temperature stations for the 1961-’90 period • 199 precipitation stations for the same period • Interpolation techniques: • Inverse Distance Weighted • Ordinary Kriging • Co-kriging • Linear Multiregressive Analysis with Residuals Kriging The statistic comparison has been made on: The multiregression has been applied on elevation, latitude, longitude and sea distance on 250-meter grid points. The residuals of the regression model has been interpolated by Ordinary Kriging.
WORKSHOP ON CLIMATIC ANALYSIS AND MAPPING FOR AGRICULTURE (Bologna, Italy, 14-16 June 2005) Methods validation approach A selection of stations, based on qualitative parameters, have been divided in two sets: • A training set where the interpolation techniqueshave been applied to give the parameters of the interpolating functions; • A verifying independent set in order to evaluate the goodness of the above functions; The assessment of each method has been carried out through Root Mean Square Error (RMSE) and the Determination Coefficient r2 between observed and predicted data for each station of the verifying set;
WORKSHOP ON CLIMATIC ANALYSIS AND MAPPING FOR AGRICULTURE (Bologna, Italy, 14-16 June 2005) Temperature interpolation Training stations Verifying stations For temperature field the methods have been verified using 39 meteorological stations for training set and 20 stations for the verifying set. The selection of stations was made about a random process
WORKSHOP ON CLIMATIC ANALYSIS AND MAPPING FOR AGRICULTURE (Bologna, Italy, 14-16 June 2005) Temperature interpolation Root Mean Square Error The lowest Root Mean Square Error has been obtained with Multiregression method
WORKSHOP ON CLIMATIC ANALYSIS AND MAPPING FOR AGRICULTURE (Bologna, Italy, 14-16 June 2005) Temperature interpolation Determination coefficient and F significance (p=0.05) Multiregression shows also the most significative determination coefficients No method is able to represent the summer spatial distribution of maximum temperature The typical summer anticyclonic regime (high pressure stabilized on the entire island) makes temperature distribution dependent from microclimatological effects.
WORKSHOP ON CLIMATIC ANALYSIS AND MAPPING FOR AGRICULTURE (Bologna, Italy, 14-16 June 2005) December maximum temperature Multiregr.r2=0.84 Krigingr2=0.26 Co-Krigingr2=0.25 IDWr2=0.33 The december maximum temperature interpolation exhibits the largest differences between multiregressive and the other methods. There is no significant difference between Kriging, Co-Kriging and IDW maps. The multiregressive method applied on geomorphological variables shows the highest determination coefficient and allows a high spatial resolution
WORKSHOP ON CLIMATIC ANALYSIS AND MAPPING FOR AGRICULTURE (Bologna, Italy, 14-16 June 2005) December maximum temperatureinterpolated on all stations with Multiregressive method
WORKSHOP ON CLIMATIC ANALYSIS AND MAPPING FOR AGRICULTURE (Bologna, Italy, 14-16 June 2005) July maximum temperature Multiregr.r2=0.23 n.s. Krigingr2=0.08 n.s. Co-Krigingr2=0.09 n.s. IDWr2=0.09 n.s. According with previous results, in July no method is able to predict the spatial distribution of the temperature
WORKSHOP ON CLIMATIC ANALYSIS AND MAPPING FOR AGRICULTURE (Bologna, Italy, 14-16 June 2005) Precipitation interpolation Training stations Verifying stations In this case the methods have been verified using 149 meteorological stations for training set and 50 stations for the verifying set. The selection of stations was made about a random process
WORKSHOP ON CLIMATIC ANALYSIS AND MAPPING FOR AGRICULTURE (Bologna, Italy, 14-16 June 2005) Precipitation interpolation Root Mean Square Error Generally the lowest Root Mean Square Error has been obtained with Multiregressive method. In summer the Co-Kriging (with elevation as co-variable) is the best interpolator.
WORKSHOP ON CLIMATIC ANALYSIS AND MAPPING FOR AGRICULTURE (Bologna, Italy, 14-16 June 2005) Precipitation interpolation Determination coefficient and F significance (p=0.05) All the techniques give significant results, but the best fits have been obtained with the stochastic and multiregressive methods, with small differences among them. The multiregressive method performs better on winter months where the distribution of precipitation is function of geomorphological parameters.
WORKSHOP ON CLIMATIC ANALYSIS AND MAPPING FOR AGRICULTURE (Bologna, Italy, 14-16 June 2005) Precipitation interpolation For the stochastic methods, also the semivariogram model appears to be season-dependent. The spatial autocorrelation analysis is made with GS+7 software
WORKSHOP ON CLIMATIC ANALYSIS AND MAPPING FOR AGRICULTURE (Bologna, Italy, 14-16 June 2005) Annual precipitation Multiregr.r2=0.69 Krigingr2=0.65 Co-Krigingr2=0.65 IDWr2=0.60 Annual precipitation is best interpolated through multiregression analysis but with small statistical differences in comparison to the stochastics methods. Nevertheless, the precipitation field on climatic scale seems to be function of geomorphological parameters but the randomness of this field does not suggest the use of this method with a high spatial resolution of the geomorphological variables grid.
WORKSHOP ON CLIMATIC ANALYSIS AND MAPPING FOR AGRICULTURE (Bologna, Italy, 14-16 June 2005) Annual precipitationinterpolated on all stations with Co-Kriging
WORKSHOP ON CLIMATIC ANALYSIS AND MAPPING FOR AGRICULTURE (Bologna, Italy, 14-16 June 2005) June precipitation Multiregr.r2=0.49 Krigingr2=0.64 Co-Krigingr2=0.64 IDWr2=0.59 Summer precipitations are often due to small scale convective systems, so the multiregressive method is not able to predict the spatial distribution.
WORKSHOP ON CLIMATIC ANALYSIS AND MAPPING FOR AGRICULTURE (Bologna, Italy, 14-16 June 2005) June precipitationinterpolated on all stations with Co-Kriging
WORKSHOP ON CLIMATIC ANALYSIS AND MAPPING FOR AGRICULTURE (Bologna, Italy, 14-16 June 2005) Some consideration oninterpolation techniques The best temperature interpolator is the multiregression analysis with residual kriging. Summer maximum temperatures, however, are poorly described by all the above methods. Due to its intrinsic randomness the precipitation field is more difficult to interpolate. The performances of the different methods appear to be season- dependent.
WORKSHOP ON CLIMATIC ANALYSIS AND MAPPING FOR AGRICULTURE (Bologna, Italy, 14-16 June 2005) Agroclimatic applications... Spatial interpolation of precipitation and temperature fields is the base of an agroclimatic analysis The results obtained on temperature field are applied to build preliminary maps of some agroclimatic indexes
WORKSHOP ON CLIMATIC ANALYSIS AND MAPPING FOR AGRICULTURE (Bologna, Italy, 14-16 June 2005) Indexes:Climatic Degree Days ST>0°C (degree days are important to evaluate the crop adaptability in specific areas) This map shows the annual degree days calculated on monthly mean temperature above 0°C. About 65% of the island is over 5500 degree days.
WORKSHOP ON CLIMATIC ANALYSIS AND MAPPING FOR AGRICULTURE (Bologna, Italy, 14-16 June 2005) Indexes:Climatic Degree Days ST>10°C This map shows the areas with annual degree days calculated on monthly mean temperature above 10°C. About 67% of the island is over 2000 degree days
WORKSHOP ON CLIMATIC ANALYSIS AND MAPPING FOR AGRICULTURE (Bologna, Italy, 14-16 June 2005) Indexes:Huglin index(index of climatic suitability for grapevine based on degree days) Sardinia have few areas with Huglin value under 1500 (above 0.2%), suitable for producing champagne-type wine and early table grape. Over 30% of the island shows Huglin values over 2500, suitable for producing dessert wine.
WORKSHOP ON CLIMATIC ANALYSIS AND MAPPING FOR AGRICULTURE (Bologna, Italy, 14-16 June 2005) Indexes:Annual Evapotranspiration (evapotranspiration is calculated by Hargreaves Samani equation on monthly interpolated temperature data) The Campidano plain and the north west of Barbagia are the areas with highest value of evapotranspiration
WORKSHOP ON CLIMATIC ANALYSIS AND MAPPING FOR AGRICULTURE (Bologna, Italy, 14-16 June 2005) Thank you for attention!