Download
1 / 18
180 likes | 319 Views
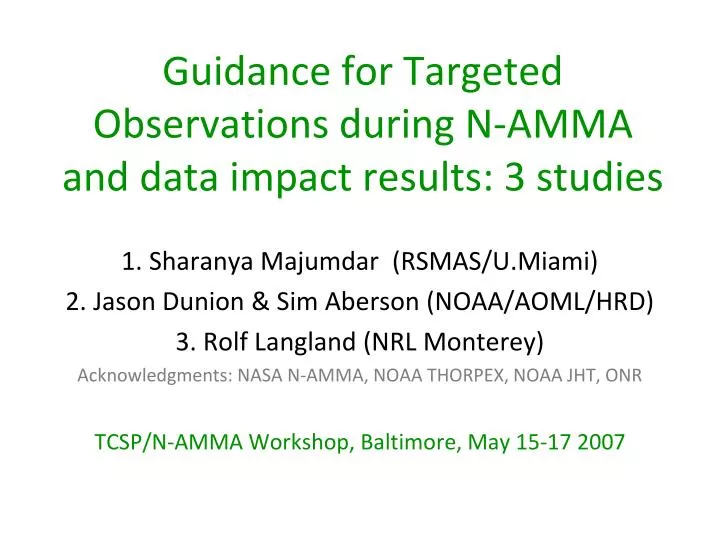
Guidance for Targeted Observations during N-AMMA and data impact results: 3 studies. 1. Sharanya Majumdar (RSMAS/U.Miami) 2. Jason Dunion & Sim Aberson (NOAA/AOML/HRD) 3. Rolf Langland (NRL Monterey) Acknowledgments: NASA N-AMMA, NOAA THORPEX, NOAA JHT, ONR

E N D
Guidance for Targeted Observations during N-AMMA and data impact results: 3 studies 1. Sharanya Majumdar (RSMAS/U.Miami) 2. Jason Dunion & Sim Aberson (NOAA/AOML/HRD) 3. Rolf Langland (NRL Monterey) Acknowledgments: NASA N-AMMA, NOAA THORPEX, NOAA JHT, ONR TCSP/N-AMMA Workshop, Baltimore, May 15-17 2007
1. Targeted Wind Observations In order to improve a 2-day forecast of 700 hPa winds offshore of west Africa, in which locations should we collect supplementary observations? Ensemble Initialization time Observing time Verification time tv ti to t 2-3 days 2 days
Targeted observing method: Ensemble Transform Kalman Filter (ETKF) • Theory: Bishop et al. (MWR 2001) • Application to winter storm reconnaissance: Majumdar et al. (MWR 2002, QJRMS 2002) • Comparison with other methods for tropical cyclones: Majumdar et al. (MWR 2006) • Need to account for: • Observation variables, operators, error (co)variance • Data assimilation scheme • Forward propagation of error variance between observation and verification times
Daily Guidance Predictions made 48 hours prior to observing time. 145-member NCEP, ECMWF and CMC ensembles Guidance was available daily by 1400 UTC on http://orca.rsmas.miami.edu/~majumdar/amma/ EXAMPLE OF GUIDANCE: AEW that developed into Helene, 9/11/06-9/15/06
A A A A
A A
Target areas: local uncertainty in wind field • Easterly Wave • Anticyclone to north • African Easterly Jet region behind wave A
Future Work • Qualitative understanding of ETKF guidance. • Identify average ‘sensitive regions’ over season. • Evaluate ability of ETKF to predict (in)sensitive areas for assimilation of observations. • Larger ensemble => better ETKF (use THORPEX TIGGE?) • Sensitivity to variables? (winds, T, mixing ratio?) • Data-impact experiments.
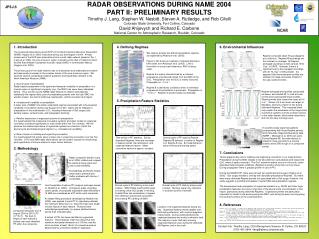
Polar 1 16 SAL 3 SAL 2 SAL 1 Irene AEW 1 21 2. Importance of Relative Humidity Saharan Air Layer Experiment (SALEX) NOAA G-IV Mission 050807n Satellite (SSMI/AMSR-E) imagery of TPW may or may not capture dry air over the ocean that affects hurricane intensity. Dry air is sometimes concentrated in a narrow mid-low level jet that is not visible in TPW. Compare 2 SALEX dropwindsondes …
Thin SAL between 600-700 hPa. Strong narrow dry jet missed by satellite. Broad SAL between 500-900 hPa. Consistent with satellite. 21 RH 16 RH 16 WIND 21 WIND
Numerical model may fail to capture local RH structure and dry air intrusion into hurricane. Drop #17 17 22 Drop #22
Potential for Targeted Humidity Observations: Helene 2006 Location of highest ensemble spread (uncertainty) is in area of high RH gradient. These locations are also where satellite and in-situ observations disagree with each other and with models.
LEFT: Influence of relative humidity (RH) data from dropwindsondeson NCEP GFS Track forecast. AVHM=with RH. T254=no RH. BEST=best track. Assimilation of RH dissipates Irene! ONE DAY LATER: RH maintains Irene! ABOVE: Assimilation of RH data in the dropwindsondes acted to dry the lower troposphere to the north-east of Irene.
Summary • SALEX data identified a narrow jet of dry air, not found in satellite data. Jet may modify hurricane intensity. • Investigate further using N-AMMA data. • Thermodynamic data altered NWP forecasts of hurricane track in a few cases. • Interaction between dry air and hurricane may be better predicted by assimilating RH in high-resolution hurricane models (e.g. HWRF), leading to improved forecasts of intensity change. • Targeted observing strategies identify locations of high RH gradient in which RH observations ought be assimilated. • Can generalize dry air intrusion beyond SAL: mid-latitude troughs; dry air advected in inflow (e.g. Hurricane Rita)
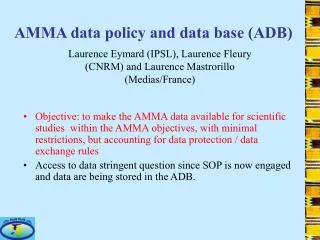
3. AMMA Data Impact on NOGAPS What is the impact of observation data in this region ? 1-30 September 2006: observations assimilated at 00UTC in NOGAPS-NAVDAS (3d-Var) – data received in real-time NRL-Monterey: Marine Meteorology Division
Methodology: • The impact of each observation can be quantified in terms of how much it reduces (or increases) the short range forecast error on the new analysis trajectory vs. the old background trajectory. • The forecast error metric is the 24hr forecast error in the global domain, energy-weighted to combine temperature, moisture, and winds from the surface to near tropopause level: forecast error units = J kg-1 • Tools required: adjoint versions of the global forecast model and the data assimilation procedure • Refs: Langland and Baker (Tellus 2004), Langland (MWR 2005) NRL-Monterey: Marine Meteorology Division
RESULTS: (negative numbers = error reduction = good!) Observation Type Impact (J kg-1) # of Obs Radiosondes -1.9192 49,353 Land-surface -0.1360 6,089 Ship-surface -0.0218 1,607 Geo-sat winds -1.5486 104,874 Aircraft -0.5107 31,246 Scatterometer winds -0.0192 390 AMSU-A radiances -0.4740 68,697 SSM/I precip. water -0.2107 31,372 Total Obs -4.8402 293,628 Results for observations assimilated at 00UTC 1-30 Sept 2006 in the region 0°N-30°N, 30°W-30°E – using data received in real-time NRL-Monterey: Marine Meteorology Division
Ranking of 8* most-valuable central African radiosonde stations – in terms of 24hr forecast error metric – NOGAPS-NAVDAS Station Lat Lon Impact (Jkg-1) #profiles Station Name 64700 12.13N 15.03E -0.4202 24 Ndjamena, Chad 61291 12.53N 7.95W -0.2783 28 Bamako, Mali 65344 6.35N 2.38E -0.2063 26 Cotonou, Benin 60018 28.32N 16.38W -0.1984 26 Tenerife, Canaries 61024 16.97N 7.98E -0.1803 28 Agadez, Niger 60680 22.80N 5.43E -0.1779 28 Tamanrasset, Algeria 61052 13.48N 2.17E -0.1188 28 Niamey, Niger 61641 14.73N 17.5W -0.0978 27 Dakar, Senegal Results for observations assimilated at 00UTC 1-30 Sept 2006 in the region 0°N-30°N, 30°W-30°E - using data received in real-time * The combined impact of all 20 radiosonde stations in the selected region = -1.9192 J kg-1, and the impact of all in-situ and satellite observation data = -4.8402 J kg-1 NRL-Monterey: Marine Meteorology Division