Download
1 / 38
380 likes | 626 Views
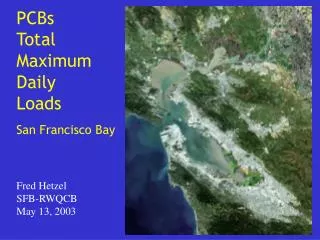
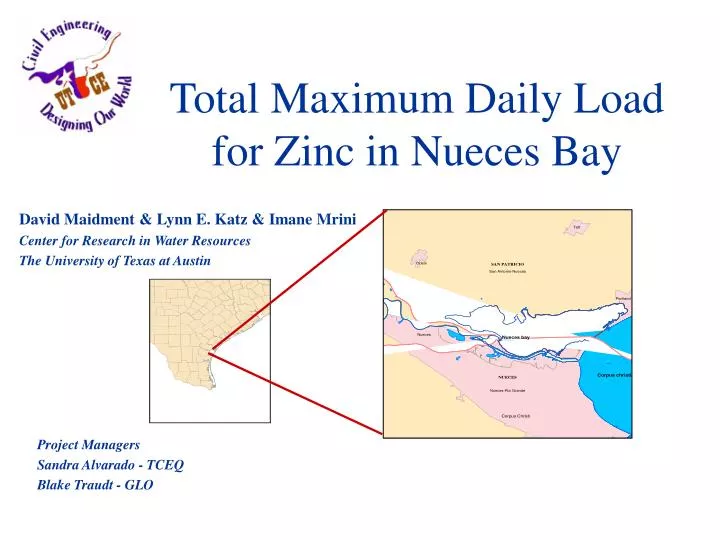
Total Maximum Daily Load for Zinc in Nueces Bay. David Maidment & Lynn E. Katz & Imane Mrini Center for Research in Water Resources The University of Texas at Austin. Project Managers Sandra Alvarado - TCEQ Blake Traudt - GLO. Zinc Impairment / criteria.

E N D
Total Maximum Daily Load for Zinc in Nueces Bay David Maidment & Lynn E. Katz & Imane Mrini Center for Research in Water Resources The University of Texas at Austin Project Managers Sandra Alvarado - TCEQ Blake Traudt - GLO
Zinc Impairment / criteria • Texas Department of Health Guidelines : • Average zinc concentrations in oysters from Nueces Bay should be consistently below 700 mg Zn/kg edible tissue • Data Observations • High concentrations (~ 2,389 mg/kg) were found in oysters resulting in acute adverse health effects (TDH, 1994); • No threat for fish or crabs
Target value : 700 ppm Zinc in Oyster Tissue
Outline • Review of issues • Study area : Nueces Bay • Zinc impairment • Study objectives • Study of Zinc monitoring data • Estimation of watershed zinc loadings • Next steps
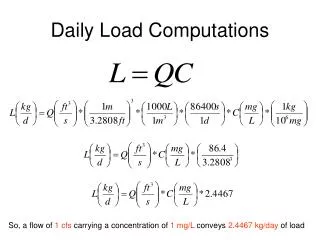
Water Quality: Pollution Loading Model Load [Mass/Time]=Runoff [Vol/Time]x Concentration [Mass/Vol] Precip. Runoff DEM LandUse Accumulated Load EMC Table Load Concentration
Expected Mean Concentration Land Use EMC Table derived from USGS water quality monitoring sites
Water Quality Analysis Salinity Concentration and Mass Fluxes in Corpus Christi Bay. Finite Segment Analysis Flow of water Transport of Constituents Fluxes Loads Advection Dispersion
Observed vs. Expected Chromium (µg/l) Zinc (µg/l)
Physicochemical Reactions sunlight Atmospheric Deposition Photochemical Reactions Inorganic Reactions Flux Flux Organic/Biological Reactions Sediment-Water Exchange
Resuspension and Deposition Deposition Resuspension
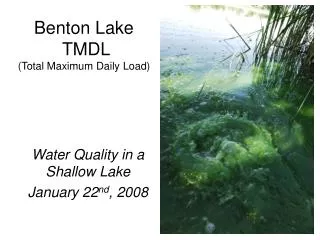
Study Area : Nueces Bay • Nueces bay TMDL segment 2482 • Average area of 74.87 Km2 Mean depth : 0.68 to 0.92m • Relatively small average residence time (V/Q) = 30 days • Uses : Aquatic life, contact recreation, fishing, production of edible oysters, clams and mussels, and shellfish harvesting (oyster water use ) • TMDL for zinc in oyster tissue
Study Objectives • Acquire existing data and information necessary to support modeling and assessment activities • Determine current allowable loadings of the constituent (zinc) • Allocate the total loadings to appropriate pollutant sources
TCEQ monitoring stations Zinc Monitoring Stations
Zinc Monitoring dataZinc in sediments Zn conc. ( ppm) 71 - 140 140.1 - 430 430.1 - 864 864.1 - 2100
Zinc Monitoring dataZinc in sediments C B Inner Harbor A Industries: A Centex Cement Corp. B Central Power and Light C PPG Industries
Zinc Monitoring dataZinc in water Zinc conc. ( g/L) 15 - 21 21.1 - 40 40.1 - 53.4 53.5 - 73.3 73.31 - 546
Zinc Monitoring dataZinc in sediments vs zinc in water Water Sediment
Hydrodynamic Circulation Simulation by Dr Junji Matsumoto, TWDB Animation
Average Zn Conc. = 100 ppm Sediment Data for Nueces Bay
Sediment Data for the Inner Harbor Average Zinc Conc. = 440 ppm
Zinc in water 0.042 ppm Zinc in sediment 100 ppm Zinc in Oyster tissue 2400 ppm Zinc Monitoring dataZinc partitioning in sediment/water/oyster tissue Ratio = 2300 Ratio = 55,000 Ratio = 24
DEM Flow_dir Watershed Watershed delineation Procedure procedure developed for delineating watersheds in coastal and low-lying regions with little to no slope.
Precipitation Runoff Land use Total Zinc Loadings = 772.9 g/day concentrations loadings EMC Table Watershed source loadings of zinc
Current watershed sources of zinc • Total annual loadings of zinc from non point source pollution : 282 kg • Volume of the bay : 62.26 Mm3 • Annual concentration of Zinc from NPS :4.53 g/L • Mean Measured concentration of zinc in water in Nueces bay : 42.1 g/L Watershed sources are not the whole picture
Estimation of Mass of Zinc in Sediments in Nueces Bay • 10 cm sediment bed depth and surface area of 74.9 km2V = 7,490,000 m3 • Mass of sediments = 1.984 x10¹⁰ kg • Average concentration of zinc in sediments = 440 ppm (mg/kg) • Total mass of zinc in sediments = 8,730 metric tons
Pollution Sources in Nueces Bay • Total mass of zinc in sediments = 8,730 metric tons • Based on 1 kg/day watershed loading it will take 24,000 years to accumulate this mass • We must have point sources or legacy sources !!
Next Steps • Estimate background levels of zinc in sediments • Evaluate point sources • Consider hydraulics between inner harbor and Nueces Bay • Suggestions …
Zinc Monitoring data Zinc in sediments at station 12960Nueces river North of Viola Basin 126.7 mg/kg
82 mg/kg Zinc Monitoring data in Nueces bay Zinc in sediments at station 13421
Zinc Monitoring data in Nueces bay Zinc in sediments at station 13422
99 mg/kg Zinc Monitoring data in Nueces bay Zinc in sediments at station 13425
865 mg/kg Zinc Monitoring data Zinc in sediments at station 13432 ( Inner Harbor Nr nav bridge)
Zinc Monitoring data Zinc in sediments at station 13430 ( Inner Harbor in Avery basin)
Zinc Monitoring data Zinc in sediments and water at station 13439( Inner Harbor)
Zinc Monitoring data Zinc in sediments at station 13432 ( Inner Harbor Nr nav bridge)