Download
1 / 27
270 likes | 393 Views
Real-Time Satellite and Surface Data for Smoke Management in California. R. Husar and S. Raffuse, CAPITA Draft Pre-Proposal, July 2001. Background and Rationale. In March 2000, the California Air Resources Board (ARB) has advanced a Smoke Management Program.

E N D
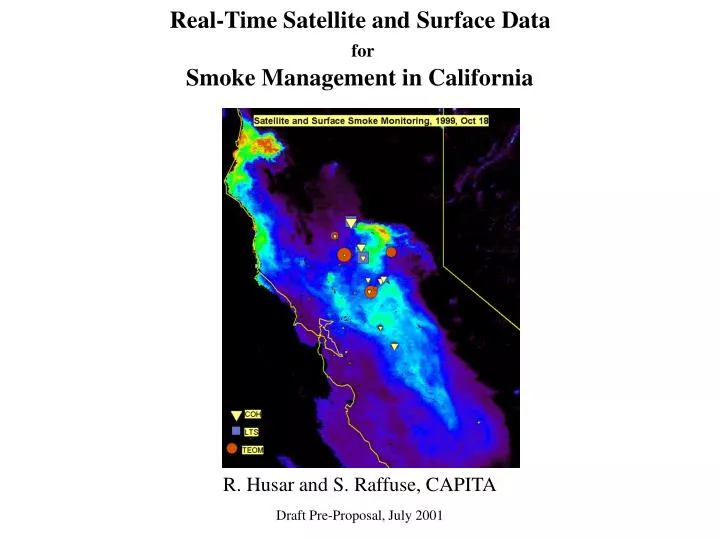
Real-Time Satellite and Surface DataforSmoke Management in California R. Husar and S. Raffuse, CAPITA Draft Pre-Proposal, July 2001
Background and Rationale • In March 2000, the California Air Resources Board (ARB) has advanced a Smoke Management Program. • The framework for minimizing smoke impacts from agricultural, forest, and range land management burning operations in California is provided in the Smoke Management Guidelines. • This pre-proposal illustrates the possible application of real-time satellite and surface data for smoke management in California. • The topics discussed here are relevant to the CARB Smoke Management Working Groups: • Meteorological Criteria • Technical Tools Development • Public Education and Outreach • The specific scope of this proposal is not yet fully developed. It is hoped that feedback from ARB and others may help focusing the scope to be both manageable and useful to ARB.
Contents • Background: Satellite-based fire climatology of the West • Real-Time Satellite Sensors: • GOES • AVHRR • SeaWiFS • MODIS • TOMS • Real-Time Surface Sensors • ASOS light scattering • TEOM/COH/Light Scattering • Summary & Status
Fire Zones of North America FIRE and Norm. Diff. Veg. Index, NDVI The ‘Northern’ zone from Alaska to Newfoundland has large fire ‘patches’, evidence of large, contiguous fires. The ‘Northwestern’ zone (W. Canada, ID, MT, CA) is a mixture of large and small fires The ‘Southeastern’ fire zone (TX–NC–FL) has a moderate density of uniformly distributed small fires. The ‘Mexican’ zone over low elevation C America is the most intense fire zone, sharply separated from arid and the lush regions. Fires are absent in arid low-vegetation areas (yellow) and over areas of heavy, moist vegetation (blue).
Seasonality of Fire Dec, Jan, Feb is generally fire-free except in Mexico, and W. Canada Mar, Apr, May is the peak fire season in Mexico and Cuba; fires occur also in Alberta-Manitoba and in OK-MO region Jun, Jul, Aug is the peak fire season in N. Canada, Alaska and the NW US. Sep, Oct, Nov is fire over the ‘Northwest’ and the “Southeast’
Seasonal Pattern of Fires over N. America (1997-99) • The number of satellite-observed fires peaks in May and July-August (1997-99) • The daily fire counts over NAM (3 yr counts for each Julian day) shows significant day to day fluctuation N America
Seasonal Pattern of Fires over the ‘West’ (30N-52N, > 100W) • The fire count over the West peaks between July and September. • The daily fire counts over the entire West varies by an 1-2 orders of magnitude during the fire season West
Fire Locations on Elevation Map (1996-2000) • Over a (short) 5-year period, the fire locations are spatially clustered • Fire locations over the Western US are mainly at higher elevations
Spatial Pattern and History of Fire Counts, CA, NV (1996-1999) • The CA-NV fires occur very sporadically. Some years (e.g. 1997) have virtually no fires while others have up to 1000 1 ‘fire pixels’/day (1999). • Within a fire season, the fire events occurs sporadically, spaced in-between fire-free periods. Elevation Map Fire Locations
CaliforniaFires (1997-2000 Large fires in California are evident as clusters of ‘fire pixels’ Large fires tend to occur at higher elevation mountainous areas The fires just south of Mexicali are distributed randomly over a larger area
Sensor Spatial Temporal Parameter Pros Cons Real-Time Satellite Sensors GOES 1 km 30 min (day) Visible, IR(4) “Fire channel” Continuous, Multi-angle Fast data access, fire sensor Single broadband channel Poor georeferencing AVHRR 1 km 2/day Vis-NIR “Fire Channel” Easy data access Fire detection channel Poor spectral resol. Poor temporal resol. SeaWiFS 1 km 1/day 8 vis channels Good spectral coverage smoke/cloud by color Poor temporal resol. Some data delayed 14 days MODIS 250 m 1/day 36 chan.(vis and IR) High spectral and spatial resol. Daily data access possible? TOMS 100 km 1/day Absorption index “Smoke detection” Poor spatial & spectral resol. Real-Time Surface Sensors ASOS >60 in CA 1/min Scatter, Ceiling, Weather High space/time resol. Data access, quality unknown TEOM 10 in CA? 1/hr PM-10, PM-2.5? Health relevant, good temp. res. Sparse spatial coverage BSCAT 5 in CA 1/hr Light scattering Visibility related Sparse spatial coverage COH 30 in CA 1/hr Absorbing Aerosol Smoke index Sparse spatial coverage. Real-Time Sensors Considered for Smoke Detection • Currently, there is a ‘sensing revolution’ taking place. • Satellite and surface monitoring systems allow real-time monitoring of fires and smoke • The challenge is to ‘harness’ the fast developing sensory information
Real-Time Satellite Smoke Monitoring GOES AVHRR SeaWiFS MODIS TOMS
GOES-Diurnal Smoke Dynamics • The primary role of the GOES satellite is to provide the dynamic smoke pattern. • GOES images (every 30 daytime minutes) reveal the transport as well as change in the smoke intensity over the day.
GOES – Fire Detection and Modeling An experimental fire locations for California are provided by the U. Wisconsin, ABBA Project based on GOES 10. Click here for the Latest Fire locations in California/Nevada The Real-Time fire locations are being used as source terms for a predictive smoke transport model. (Naval Res. Lab – Doug Westphal). Click here to view latest forecast loop.
AVHRR Fire and Smoke Detection – May 2001 Florida Fires • NOAA AVHRR satellites pass over an area daily • The AVHRR sensors provide both fire location and smoke pattern
California Fires, Sept, 28, 1999 (SeaWiFS) Smoke & fire Smoke-no fire? The fire locations are identified as red dots (ATSR) The smoke is yellow near the fire and bluish further away Smoke & fire The aerosol backscattering is retrieved from the satellite The smoke is yellow near the fire and bluish further away
California Fires, Oct, 28, 1999 (SeaWiFS) • gwetwet SeaWiFS satellite data shows the smoke ‘hotspot’ The smoke is confined by the topography - the mountains extrude from the smoke layer. Hence, the smoke in the basin is near the surface The dense smoke indicates that the fire is in N. California Sierra Mountains However, the smoke has spread over much of the San Joaquin Basin.
MODIS fire and smoke detection – Idaho fires Aug 2000 Wei Min Hao, Yoram Kaufman • The Forrest Service (Wei Min Hao) is setting up a MODIS Direct Broadcast receiving station which would also cover California. • The FS MODIS data would allow daily high-space and spectral resolution fire/smoke monitoring.
TOMS Absorbing Aerosol Index • The TOMS sensor qualitatively detects absorbing aerosols • It is useful for tracking continental/global-scale dust and smoke events • On October 18, the smoke from the California fires is detected by TOMS.
Real-Time Surface Observations ASOS light scattering TEOM PM Light Scattering COH
Surface Aerosol Monitoring CARB has an extensive aerosol monitoring network TEOM (PM2.5), Nephelometer (Bscat), Coeff. Haze (COH) is monitored hourly The FAA/NWS ASOS system has over 60 sites with 1 minute light scattering data In principle, these aerosol data are available for real-time monitoring during smoke events However, the real-time access and other possible problems with these data these data are not known.
CARB Aerosol Monitoring during a Smoke Event, Oct. 18, 1999 There are over a dozen CARB aerosol sites that are exposed to smoke in the Central Basin on Oct. 18, 1999 The satellite data reveals that most in the smoke puffs in the central valley is not monitored The N. California smoke plume has no real-time monitors The 3 aerosol monitors show peak smoke concentration in the 200 mg/m3 range There is a distinct daytime peak of smoke concentration The ‘composition’ of the smoke varies; some puffs are high in scattering, others high in absorption
Year-to-Year Variation In 1997 (and 1998) the aerosol concentration (TEOM, COH, LTSC) in Aug., Sep., Oct was low. In 1999, there were numerous fires and intense smoke over much of California. The year-to-year and hourly smoke pattern can be detected by current CARB instrumentation. However, the spatial coverage of the aerosol sites is poor.
ASOS Visibility Monitoring System • The instrumental visibility data are part of the Automated Surface Observing System, ASOS, with 860 + sites over the country. • The Belfort Model 6220, senses the forward light scattering (30-500) of white light, in situ. The nominal sensitivity is 17 ft to 30 miles. • The synoptic ASOS stations distribute the data through the WMO system. • The data are truncated into 18 distinct visual range bins: <1/4, 1/4,….,10+ miles. For smoke events with visibility well below 10 miles, this is not a severe limitation. • The one-minute un-truncated data are stored on the on-site computer for 12 hours and in principle, it can be accessed remotely during that time. • CAPITA, with grants from NOAA and EPA, is currently working on a pilot project for real-time ASOS data access and data quality evaluation.
ASOS Light Scattering-PM2.5 • It is known that total (nephelometer) light scattering correlates well with fine particle mass, except under very humid and dusty conditions. • Furthermore, Richards et al., 1996, found that ASOS forward scattering values at Logan Airport correlated well with hourly TEOM PM 2.5 data in S. Boston • It is known that total (nephelometer) light scattering correlates well with fine particle mass, except under very humid and dusty conditions. • Furthermore, Richards et al., 1996, found that ASOS forward scattering values at Logan Airport correlated well with hourly TEOM PM 2.5 data in S. Boston
ASOS Summary and Evaluation • The data from the 67 station ASOS light scattering network with 1-minute time resolution would make significant contribution to real-time smoke monitoring in California. • The ASOS data would augment both the satellite and more direct real-time aerosol measurements and aid smoke forecast models. • The main difficulties include accessing the data real time and the unknown quality of the ASOS scattering data. ASOS Sites (67) AWOS Sites (32) Data access & quality unknown
Proposal - Outline • It is proposed to use daily MODIS (if data available), SeaWiFS (for historical fires) and half-hourly GOES images to characterize the spatial pattern and dynamics of smoke. • The surface smoke concentration is to be determined from the CARB real-time aerosol sensors and from 60+ ASOS light scattering sensors at airports. • The ASOS network is believed to be suitable for mapping the surface concentration of smoke, but the real-time accessibility and the quality of ASOS data in California needs to be evaluated. • The satellite and surface data need to integrated and fused to yield a more complete picture of the smoke pattern. • Furthermore, the satellite and surface-based monitoring data need to be assimilated into a suitable smoke forecast model (to be developed by others). • Considering the many applications and challenges of the integrated real-time satellite and surface aerosol data system, it is proposed to conduct the project as a stakeholder partnership. • The CAPITA group is interested in facilitating the data integration in such a California smoke monitoring and forecasting partnership.