Download
1 / 29
290 likes | 438 Views
Adapting the Balanced Scorecard as a Management System in a British Local Authority John Tatam Corporate Director of Resources and Deputy Chief Executive “Quality Management in the Public Sector†Vilnius, 27-28 March 2006. Scale. Population 164,000

E N D
Adapting the Balanced Scorecard as a Management System in a British Local Authority John Tatam Corporate Director of Resources and Deputy Chief Executive “Quality Management in the Public Sector” Vilnius, 27-28 March 2006
Scale Population 164,000 Gross Budget £450 m Staff c9,000
Service Responsibilities Education (schools) Social Services Housing Environment Leisure Culture
Our Past - Performance Management Collected PIs - c. 150 statutory - over 300 “local” But, didn’t use Didn’t know if measuring the right things
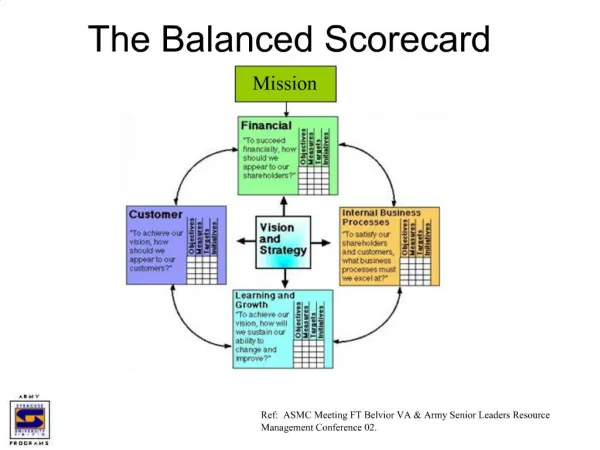
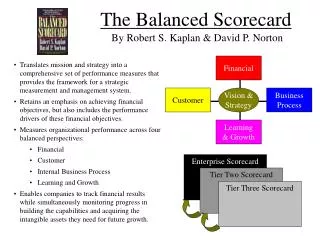
Adapting The Balanced Scorecard • Developed for the Private Sector • - bottom line at the top • For local government • - Finance less critical • - Community Perspective (well being) as well as customers • - separate services with different regulatory • frameworks
Community Priorities • Promoting equal opportunities and celebrating diversity • Better education and learning for all • Developing rights and responsibilities with the local • community • Improving Health, Housing and Social Care • Making Barking & Dagenham cleaner, greener and safer • Raising general pride in the Borough • Regenerating the local economy
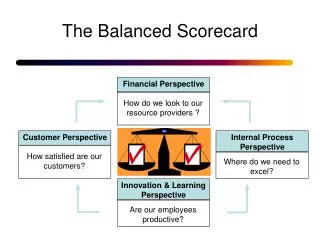
Community First Customer First Funding the Future People Matter Performance Counts
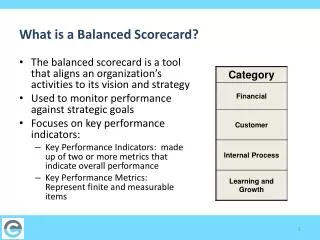
Developing the Scorecard • What are we trying to achieve? (Community Priorities) • What key things do we need to get right to achieve them? (Strategic Objectives) • How do we know if we are getting there? (Measures and Targets)
(7) Regenerating the Local Economy (1) Raising General Pride in the Borough (2) Promoting Equal Opportunities & Celebrating Diversity (3) Developing Rights and Responsibilities with the Local Community (4) Improving Health, Housing and Social Care (5) Making Barking & Dagenham Cleaner, Greener & Safer (6) Better Education and Learning for All (8) Meeting Customer Needs First (9) Providing Accessible, Local Services (10) Improving Standards (11) Customer First Programme (12) Every Pound Counts (13) Improving Procurement Practice (14) Integrated Financial and Service Planning (17) Excellence Through Partnerships (15) Redesign Processes and Programmes to put Customers First (16) Performance and Accountability (18) Building Confidence, Enhancing Reputation (21) Sharing Learning and Best Practice (19) Become an Employer of Choice (20) Empowering Staff through Investment (23) Supporting and Rewarding Innovation and Risk (22) Increase Strategic and Political Leadership Capacity The Barking and Dagenham Council Scorecard Strategy Map Community First Customer First Funding the Future Performance Counts People Matter
CS1 % of residents with a positive perception of the Borough CS2a The level of the “Equality Standard” for local government to which the Council conforms CS2b % of public sector bodies operating in the borough that have an Equalities Policy CS2c % of public sector bodies operating in the borough that monitor the Equalities Policy. CS3 % of residents who feel involved / consulted with CS4a Number of deaths by Heart Disease (per 100,000) CS4b All cancer mortality rate CS4c Under 18 conception rate CS4d % of homes that meet the decency standard as a % of total public stock as at 1 April CS4e % of homes that meet the decency standard as a % of total private stock CS5a % of residents surveyed who said that they feel ‘fairly safe’ or ‘very safe’ after dark whilst outside in the local authority area CS5b % of residents surveyed who said that they feel ‘fairly safe’ or ‘very safe’ during the day whilst outside in the local authority area CS5c % of residents with a positive perception of the overall appearance of the Borough CS6a % of education & learning indicators above national average CS6b % of education & learning indicators at or above top quartile CS7 Average income ranking of B & D citizens in comparison with the rest of London (33 London authorities) Community First The Council Scorecard Performance Indicators Funding the Future CS12a % of cost indicators in the best quartile CS12b% of capital budget spent against the programme CS13a% of residents satisfied with services provided by services provided under contract" (to focus on external impact of procured services) CS13b % of spend internal vs external spend CS13c % of improvement in customer satisfaction of services delivered through contract CS13d % of contract variance compared to contract price (to monitor contract compliance and process) CS14% of key milestones in Medium Term Financial Strategy (MFTS) achieved Customer First CS8 % of residents satisfied with the overall service provided CS9 % of fair access indicators at or above top quartile CS10 % of quality and service outcome indicators at or above top quartile CS11 % of enquiries dealt with fully on first point of contact People Matter CS18 1-10 rating by key stakeholders of average score against 7 reputation drivers CS19a Thenumber of working days/ shifts lost de to sickness absence (BV12) CS19b % of staff working flexibly CS19c Staff Attitude Survey - % stating that B&D is a good employer CS20a Corporate IIP achieved. Yes or No? CS20b Level of IIP accreditation achieved CS21 % of managers able to demonstrate that they share best practice- CS22a Number of members who have a personal development plan CS22b % of staff satisfied that the leadership of their manager enables them to place their work in the context of the Community Priorities and/or strategic objectives CS23 Number of staff suggestions for service improvement implemented Performance Counts CS15 The number of types of interactions that are enabled for electronic delivery as a % of interactions that are legally permissible for electronic delivery CS16a % of BVPIs in top 25% (excluding cost based PIs) CS16b % of BVPIs in middle 50% (excluding cost based PIs) CS16c % of BVPIs in bottom 25% (excluding cost based PIs) CS17a % of available brownfield land used for development purposes CS17b % of PSA targets met on an annual basis
Choosing Measures “Measurement is the language which gives clarity to vague concepts” R. Kaplan “Measures define success for an organisation” Andy Neely
Regenerating the Local Economy • Definition • - Creating more wealth for local people. • - Helping local people with the skills and training to get • good quality jobs. • - Enterprise and investment in the Borough. • Measure • Average income of Barking and Dagenham citizens in comparison with the rest of London
Performance and Accountability Definition To maximise the number of BVPIs which are in the top 25%. Measure CS16a – % of BVPIs in top 25% (excluding cost based PIs). CS16b – % of BVPIs in middle 50% (excluding cost based PIs). CS16c – % of BVPIs in bottom 25% (excluding cost based PIs).
Increase Strategic and PoliticalLeadership Capacity DefinitionTo enable members to articulate their policies internally and externally. Projecting the Borough in the local/ regional/ national political stages. Ensuring that all staff are aware of the policies of the Council. Measure CS22a – Number of Members who have a Personal Development Plan. CS22b – % of staff who are satisfied that the leadership of their manager enables them to place their work in the context of the Community Priorities and/ or strategic objectives.
Service Scorecards Each of the 29 Service Heads produce a scorecard. This both translates the corporate scorecard at service level and takes account of specific service pressures e.g. from government departments.
Scorecard Packs Each Head of Service produces: • Service Strategy (or strategies) - what are they trying to achieve • A Scorecard of strategic objectives and measures • An implementation plan of how they will deliver the Scorecard
Lifelong Learning and Inclusion Strategy Map (1) Raising aspirations and standards (2) Early intervention Community First (3) Focus on full range of learners needs (4) Maximise participation rates (5) Work effectively with a range of partners (6) Effective use of all available sources (7) Effective use of national and local initiatives Funding the Future Customer First (8) Learning opportunities of the highest quality (9) Effective use of workplace learning (10) Statutory compliance (11) Children First (rights and entitlement) Performance Counts (12) High quality training and professional development (13) Improve communications (14) Greater cross-divisional working (15) Promote equal opportunities and celebrate diversity (16) Support Equalities targets and priorities in the department People Matter
At the Heart of What We Do Ensuring the Scorecard drives the management of the Council - BVPP - Response to CPA - PSA - Personal Performance Management Is it in your scorecard?
J How focus improved our performance to above top quartile.
CPA K Quartile bandings are shown on the graph. Performance is currently in-between upper and lower thresholds for CPA.
MemberPortfolio PI Key Threshold J
The Impact The scorecards link community priorities to strategic objectives and individual performance. • Staff can see their place in the bigger picture. • Genuine enthusiasm for the Balanced Scorecard. • A real focus on performance management. • Elected Councillors can focus on strategy. Services are improving – 70% of PIs improved.
The Lessons • Leadership and Consistency • Keep up the energy • Focus on improvement, not the system • Keep it simple - but not simplistic • Keep restating the basics
Improving Performance Four tests of Performance Management: • Does it focus on what is important for this organisation/service? • Do the measures define what success means for us? • Do we know if we are making progress? • Do we act on the information?
Performance Breakthroughs “The strengths in this Authority’s approach are that they set out for a simple approach and have put effort into keeping it simple. They have worked out how to make the system work for them and they have encouraged local ownership … They recognised that the discussion people had about services during the delivery process were as important as the framework itself…”
Want to know more? • Web site: www.lbbd.gov.uk (Under “About the Council” or Search on “balanced scorecard) • Contacts: john.tatam@lbbd.gov.uk sandra.hamberger@lbbd.gov.uk
John Tatam Corporate Director of Resources and Deputy Chief Executive