Download
1 / 20
200 likes | 322 Views
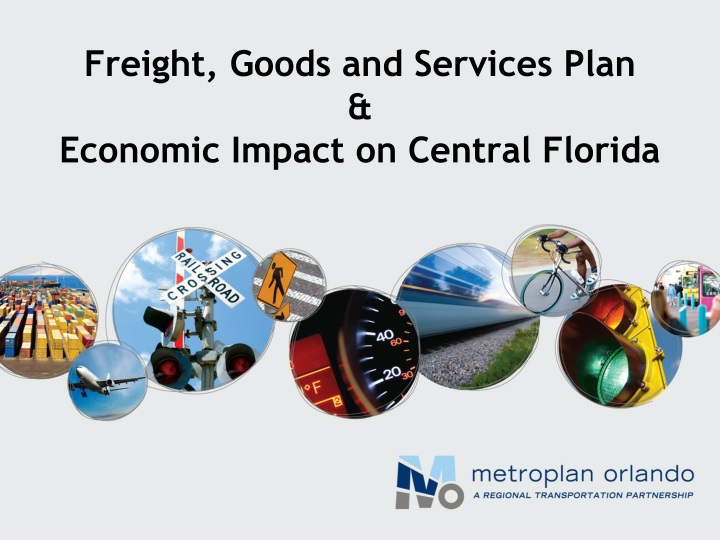
Freight, Goods and Services Plan & Economic Impact on Central Florida. Freight Advisory Council Florida Dept. of Transportation Freight Industry Professionals Transportation Planners/Engineers Economic Development Staff Land Use and Real Estate Experts. How Much Freight?.

E N D
Freight, Goods and Services Plan&Economic Impact on Central Florida
Freight Advisory Council Florida Dept. of Transportation Freight Industry Professionals Transportation Planners/Engineers Economic Development Staff Land Use and Real Estate Experts
How Much Freight? Imports37.9 million tons Within Region20.6 million tons Through* 120.6 million tons Exports23.1 million tons Source: 2010 FDOT Trade and Logistics dataset and 2009 full Surface Transportation Board (STB) Waybill dataset. a The base year for the rail data is 2009. Through rail moves were not included due to the inability to estimate it with the full Surface Transportation Board (STB) Waybill dataset.
How Much Freight? Direction 2010a Millions Inbound 37.9 Outbound 23.1 Intraregional 20.6 Throughb 120.6 Total 202.3 Source:2010 FDOT Trade and Logistics dataset and 2009 full Surface Transportation Board (STB) Waybill dataset. a The base year for the rail data is 2009. b Through rail moves not included due to the inability to estimate it with the full Surface Transportation Board (STB) Waybill dataset.
Freight Generators Outbound freight by originating county
Freight Attractions Inbound freight by destination county
What is Moving?Top 10 Commodities Source: 2010 FDOT Trade and Logistics dataset and 2009 full Surface Transportation Board (STB) Waybill dataset.
How is Freight Moving? Note: Does not include through rail volumes
Forecast Summary 35% growth
Challenges and Recommendations Challenges Solutions
Capacity and Mobility • Travel demand model results for overall level of service and truck volume growth • Trucking GPS data to analyze existing bottlenecks and key corridors • Corridor fact sheet for intermodal connectors and key freight corridors • Existing and on-going studies
Community Impacts • Economic competitiveness • Air quality • Safety • Environmental justice • State of repair • Land use conflicts
Institutional and Regulatory • Examine federal, state and local legislation and ordinances for freight specific issues • Examine funding sources relative to needs • Document potential implications and mitigation strategies
Preparing Recommendations • Strategic recommendations on how to avoid and mitigate incompatibilities between freight movement and non-freight land uses • Examples of location where these strategies may be applied.
Project Schedule • Air Cargo Market Study – Feb FAC meeting • Logistics and Land Use Profile– March FAC • Needs Assessment & Draft Recommendations – June FAC