Download
1 / 31
320 likes | 421 Views
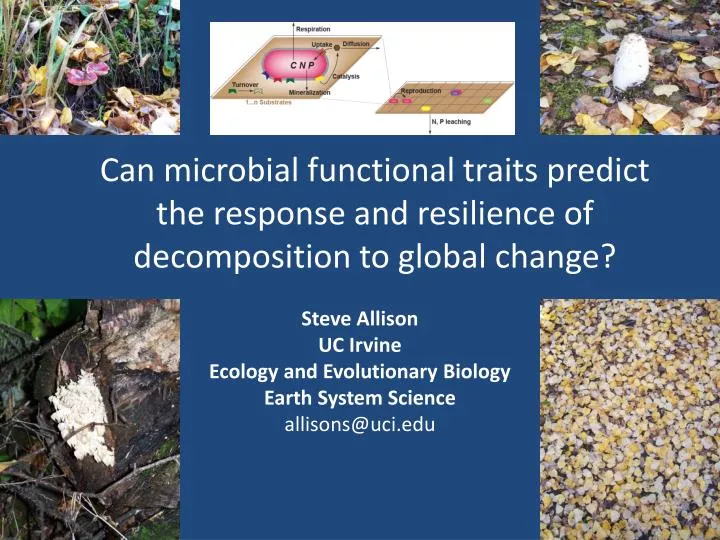
Can microbial functional traits predict the response and resilience of decomposition to global change? . Steve Allison UC Irvine Ecology and Evolutionary Biology Earth System Science allisons@uci.edu. Project goals.

E N D
Can microbial functional traits predict the response and resilience of decomposition to global change? Steve Allison UC Irvine Ecology and Evolutionary Biology Earth System Science allisons@uci.edu
Project goals • Determine how microbial taxa respond to reduced precipitation and increased N • Determine the distribution of enzyme genes among taxa • Predict enzyme function and litter decomp based on first two goals • Test if microbial communities are resilient to environmental change
Litter origin Plot A Ambient A N A N Nitrogen experiment Nitrogen enriched A N A N Precip reduced Mic. comm. origin A P A Ambient Precip experiment N Nitrogen enriched A P P Precip reduced A P B A P inoculation 2013 composition samples 2012 2011 additional samples June Feb June Dec Dec Feb Feb Dec
Allison lab responsibilities • Litter mass remaining • Fungal and bacterial counts • Microscopy (fungi), flow cytometer (bacteria) • Extracellular enzyme activities • Litterbag and plot-level • Litter chemistry • nIR, C/N analysis • Decomposition model
Litter mass remaining: Drought • Microbes from reduced water leave more mass remaining (6-12 months) • Less mass loss in reduced water plots (6 months)
Litter mass remaining: N addition • Significant plot by litter interactions that differ at 6 vs. 12 months
Fungal counts: Drought • More fungi in reduced water plots (3-6 months) • Significant and contradictory microbial origin effects
Bacterial counts: Drought • Strong negative effects of reduced water; microbial origin effect disappears by 6 months
Bacterial counts: N addition • Positive effect of N in litter origin at 6 months
Enzymes: Drought • Higher activities of all hydrolytic enzymes except LAP
Enzymes: N addition • Higher LAP in fertilized litter; other effects are weak
Initial litter chemistry • Similar for litter from control and added N plots • Litter from reduced water plots has more lignin, protein, labile compounds; less cellulose and hemicellulose • Some differences are maintained after 3 months:
Litter chemistry: Drought • 3-6 months: relatively more labile constituents remaining in reduced water plots
Litter chemistry: N addition • Greater lignin loss in litter from N plots (6 months)
Data summary • Reduced water effects generally stronger than N effects • Direct effects of plot on decomposition generally stronger than indirect effects on plants and microbes • Reduced water favors fungi over bacteria, slows decomposition, and allows enzymes and labile substrates to accumulate
Project goal: model integration • Incorporate disturbance responses and gene distributions into a model • Predict response of litter decomposition to treatments • Validate model with reciprocal transplant results
Approaches to modeling decomposition Exponential decay (Olson 1963) Schimel and Weintraub (2003) Moorhead and Sinsabaugh (2006) “Guild decomposition model” (functional groups)
What is a “trait-based” model? • Organisms are represented explicitly (biomass, physiology, etc.) • Each taxon possesses a specific set of trait values • Trait values can be randomly chosen and/or empirically derived • Community composition is an emergent property www.brooklyn.cuny.edu
Represented traits • Extracellular enzymes and uptake proteins: • Gene presence/absence • Vmax, Km • Specificity • Production and maintenance costs • Carbon use efficiency • Cellular stoichiometry • Dispersal distance www-news.uchicago.edu
Example question and application • Under what conditions are generalist versus specialist strategies favored? • Generalist = broad range of enzymes produced Specialist Generalist
Model set-up • 100 taxa, 100 x 100 grid • Taxa may possess 0 to 20 enzymes • 12 chemical substrates (approximates fresh litter) • Each degraded by at least 1 enzyme Enzymes Substrates Vmax values Taxa Enzymes
Model set-up • Equivalent uptake across taxa • Could also implement uptake matrices Transporters Monomers Vmax values Taxa Transporters
Model experiments • Simulate leaf litter decomposition (no inputs) • Test effect of tradeoffs in enzyme traits • Increase litter N or lignin • Model validation with Hawaiian litter
Model results • Taxa vary in density over time (succession)
Model results • Should be selection to link uptake with enzymes Enzymes and uptake correlated No correlation
Model results • Species interactions are present but vary by taxon and model conditions
Model validation • Fits are better for decomposition than enzymes R2 = 0.35 P < 0.001 R2 = 0.81 P < 0.001 Slope = 1.7±0.2
Model summary • Enzyme genes and uptake proteins should be correlated • Species interactions may be important • Empirical and genomic data can tell us about tradeoffs, trait correlations, and trait distributions
Thank you! NSF ATB, DOE BER, audience