Download
1 / 20
200 likes | 317 Views
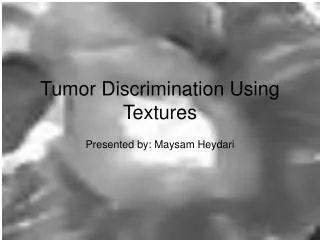
Tumor Discrimination Using Textures 2. Presented by: Maysam Heydari. Introduction. Main goal: Discrimination between different tumor grades/types using textural properties Tumor pathologies: Grade 2: astro (7), oligo (22) Grade 3: aa (2), ao (1), amoa (1) Grade 4: gbm (17).

E N D
Tumor Discrimination Using Textures 2 Presented by: Maysam Heydari
Introduction • Main goal: Discrimination between different tumor grades/types using textural properties • Tumor pathologies: • Grade 2: astro (7), oligo (22) • Grade 3: aa (2), ao (1), amoa (1) • Grade 4: gbm (17)
Method 0 • For each patient, T1, T1C, and T2 histograms constructed over all the tumor pixels (texture intensities) over all slices. • Histograms normalized and ranges adjusted over all tumors.
Method 0 • Each patient’s tumor is represented by a histogram for each modality and texture feature. • The histograms are used as vector inputs to kmeans (k = 2) clustering.
Results 0 lowgrade/highgrade: mismatch rates T1 T1C T2 Raw 0.4000 0.4600 0.4400 1st MR8 0.3400 0.3600 0.5000 2nd MR8 0.3000 0.3800 0.4800 3rd MR8 0.2800 0.3800 0.3800 4th MR8 0.3600 0.3200 0.4200 5th MR8 0.4400 0.3000 0.4800 6th MR8 0.3400 0.3000 0.4600 7th MR8 0.2000 0.4200 0.2400 8th MR8 0.2800 0.4800 0.2000 Energy 0.4400 0.3200 0.4600 Contrast 0.3800 0.2800 0.4200 BGLAM 0.3200 0.2000 0.4200
Results 0 gbm/rest: mismatch rates T1 T1C T2 Raw 0.4400 0.4600 0.4000 1st MR8 0.3400 0.4400 0.4600 2nd MR8 0.3000 0.4200 0.4400 3rd MR8 0.3200 0.3800 0.3400 4th MR8 0.3600 0.4000 0.4200 5th MR8 0.4400 0.3800 0.4400 6th MR8 0.3400 0.3400 0.4200 7th MR8 0.2800 0.5000 0.2400 8th MR8 0.3600 0.4400 0.2000 Energy 0.4400 0.3200 0.4600 Contrast 0.3800 0.3600 0.3800 BGLAM 0.3200 0.2000 0.4200
Conclusions 0 • Gaussian and LoG filter features cluster (k = 2) well with few mismatches on T2. • BGLAM symmetrical similarity features cluster (k = 2) well on T1C. • Oligos are prominent among the mismatches.
Method 0.1) • Compare the grouping of oligos (22) and gbms(17) in the kmeans clusters for k = 2, 3, 4. • How well are oligos grouped together? • How well are gbms grouped together ? • Consider clusters that contain 60% or more of tumors of a certain type: oligo or gbm.
Results 0.1) k = 2 oligo gbm T1 T1C T2 T1 T1C T2 73 68 0 0 88 0 68 0 68 76 94 71 64 0 68 82 94 65 64 0 82 82 88 71 68 0 0 65 88 76 0 0 0 88 94 76 68 0 64 76 88 71 68 0 64 100 82 88 0 0 73 100 0 88 0 0 64 94 94 88 0 0 68 82 94 0 0 0 0 76 71 0 64 68 0 82 100 71 Raw 1st MR8 2nd MR8 3rd MR8 4th MR8 5th MR8 6th MR8 7th MR8 8th MR8 Energy Contrast Correlation BGLAM
Results 0.1) oligo gbm T1 T1C T2 T1 T1C T2 64 0 0 0 65 0 0 0 0 65 76 0 0 0 0 0 76 0 64 0 0 0 88 0 0 0 0 0 82 0 0 0 0 65 82 76 0 0 0 0 76 0 68 0 68 65 71 76 0 0 64 0 71 71 0 0 0 0 0 65 0 0 0 0 82 0 0 0 0 0 65 0 0 0 0 65 71 71 k = 3 Raw 1st MR8 2nd MR8 3rd MR8 4th MR8 5th MR8 6th MR8 7th MR8 8th MR8 Energy Contrast Correlation BGLAM
Results 0.1) k = 4 oligo gbm T1 T1C T2 T1 T1C T2 0 0 0 0 65 0 0 0 0 0 76 0 0 0 0 0 76 0 0 0 0 0 0 0 0 0 0 0 82 0 0 0 0 0 82 0 0 0 0 0 71 0 0 0 0 0 0 0 0 0 68 0 0 0 0 0 0 0 0 0 0 0 0 0 82 0 0 0 0 0 0 0 0 0 0 65 65 0 Raw 1st MR8 2nd MR8 3rd MR8 4th MR8 5th MR8 6th MR8 7th MR8 8th MR8 Energy Contrast Correlation BGLAM
Conclusions 0.1) • gbms cluster well on T1C. • oligos cluser very poorly on T1C and generally poorly on T1 and T2.
Method 1 • Run SVM with linear kernel on the histograms as vectors. • Train on the 50 tumors and test on the 50 tumors (training error). • 3fold validation … (test error). • Classes: • lowgrade (astro2, oligo) vs. highgrade (aa, ao, amoa, gbm) • gbm vs. the rest
Results 1 lowgrade/highgrade 3-fold testing misclassification errors (%) T1 T1C T2 35 53 38 47 41 31 59 65 50 47 47 44 18 29 38 41 53 44 41 35 38 29 35 19 53 59 50 24 41 50 47 47 25 47 65 50 29 47 31 12 24 31 47 47 56 47 59 69 12 35 25 41 29 31 47 47 63 29 24 44 35 53 56 29 29 19 53 41 75 18 29 19 35 29 13 41 59 44 24 24 19 59 47 56 29 29 25 53 53 50 53 53 69 12 29 19 53 59 69 41 59 38 65 47 44 35 24 6 47 65 63 12 29 19 53 59 44 Training misclassification errors (%) T1 T1C T2 0 0 0 14 0 10 10 2 8 4 2 4 16 2 8 8 0 2 14 0 2 0 2 0 0 0 0 2 0 8 20 0 18 12 4 0 16 4 14 Raw 1st MR8 2nd MR8 3rd MR8 4th MR8 5th MR8 6th MR8 7th MR8 8th MR8 Energy Contrast Correlation BGLAM Raw 1st MR8 2nd MR8 3rd MR8 4th MR8 5th MR8 6th MR8 7th MR8 8th MR8 Energy Contrast Correlation BGLAM std<12 and mean<35
Results 1 gbm/rest 3-fold testing misclassification errors (%) T1 T1C T2 47 65 44 41 41 31 53 53 56 47 47 38 24 35 38 47 76 50 41 35 44 35 24 13 59 53 63 35 35 56 41 41 31 71 47 50 35 47 31 12 41 13 53 71 38 12 29 44 18 35 13 53 59 50 59 47 56 35 12 25 59 65 69 53 29 13 76 29 56 41 41 6 59 24 25 47 53 31 35 41 19 47 47 50 35 24 31 65 59 38 24 53 44 18 35 19 65 59 63 47 76 38 71 41 50 47 35 19 41 59 56 12 29 25 35 53 38 Training misclassification errors (%) T1 T1C T2 0 0 0 12 2 12 12 0 6 0 0 2 20 0 16 10 0 8 16 2 10 0 0 0 0 0 0 4 0 10 20 4 18 12 12 6 12 2 8 Raw 1st MR8 2nd MR8 3rd MR8 4th MR8 5th MR8 6th MR8 7th MR8 8th MR8 Energy Contrast Correlation BGLAM Raw 1st MR8 2nd MR8 3rd MR8 4th MR8 5th MR8 6th MR8 7th MR8 8th MR8 Energy Contrast Correlation BGLAM std<12 and mean<35
Conclusions 1 • Reiterates: • gbm discriminates well on T1C. • Gaussian and LoG good discriminating textural features. • BGLAM symmetric similarities discriminate well on T1C.
Method 2 • Combine all texture features: • For each tumor, use mean and std. • Combine mean and std values of all texture features for each tumor. • On the combined texture features: • 2.1) Run kmeans (k = 2) • 2.2) Run SVM with linear kernel • Classes: • lowgrade (astro2, oligo) vs. highgrade (aa, ao, amoa, gbm) • gbm vs. the rest
Results 2.1) Any clusters that contain 60% or more of tumors of a certain type: oligo or gbm. Clustering mismatch errors (%) lowgrade/highgrade: T1 T1C T2 36 32 42 gbm/rest T1 T1C T2 44 28 42 oligo gbm T1 T1C T2 T1 T1C T2 73 77 0 0 0 76 0 0 0 71 0 0 0 0 0 71 0 0 k = 2 k = 3 k = 4
Results 2.2) lowgrade/highgrade: Training misclassification errors (%) T1 T1C T2 0 0 0 3-fold testing misclassification errors (%) T1 T1C T2 29 18 6 18 12 624 6 19 gbm/rest Training misclassification errors (%) T1 T1C T2 0 0 2 3-fold testing misclassification errors (%) T1 T1C T2 53 6 0 41 6 6 47 12 19 std<12 and mean<35
What’s Next? • Analyze mismatches and misclassified tumors more closely. • Test SVM on new data? • BGLAM features use symmetry … incorporate symmetry with other features? • Ignore 3rd grade tumors (aa, ao, amoa) and only look at grade 2 (astro2, oligo) vs. gbms? • More thorough svm testing? • Need more gbms? • …