Download
1 / 32
320 likes | 433 Views
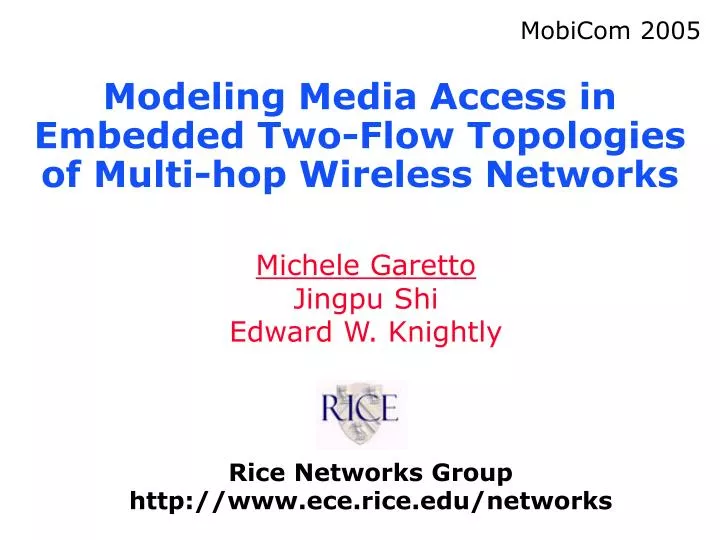
MobiCom 2005. Modeling Media Access in Embedded Two-Flow Topologies of Multi-hop Wireless Networks. Michele Garetto Jingpu Shi Edward W. Knightly. Rice Networks Group http://www.ece.rice.edu/networks. Motivation.

E N D
MobiCom 2005 Modeling Media Access in Embedded Two-Flow Topologies of Multi-hop Wireless Networks Michele Garetto Jingpu Shi Edward W. Knightly Rice Networks Group http://www.ece.rice.edu/networks
Motivation • Multi-hop wireless networks employing CSMA/CA protocols exhibit complex behavior and are difficult to analyze • Root cause: different and incomplete channel state information among flows • Most of existing modeling techniques only consider the case in which all stations are in radio range • When stations are not all in radio range, severe unfairness can occur among flows: • Long-term unfairness : some flows can starve completely • Short-term unfairness : flows alternate phases in which dominate each other in terms of throughput
Our contribution • We decompose a large-scale network into embedded subgraphs, each consisting of four nodes and two flow pairs • We identify all possible two-flow scenarios and propose a novel classification of them • We compute the occurrence probability of each scenario under random nodes deployment • We accurately study the performance of random access in all cases not analyzed so far in the literature
Senders A, B Receivers a, b A-a, B-b must be connected (= in radio range) Nodes from one flow may hear nodes from the other Four possible connections that can exist – or not 24 = 16 combinations Ab, Ba interchangeable 4 redundant scenarios Basic two-flow, four-node layout AB A B Ab aB a b AB
Twelve possible scenarios AB AB AB A B A B A B A B Ab Ab Ab aB aB a b a b a b a b ab ab AB AB AB A B A B A B A B Ab aB aB a b a b a b a b ab ab A B A B A B A B Ab aB aB aB a b a b a b a b ab ab
a A a a a a a a a a a A A A A A A A A A a A b b b B B b b b b b b B b B B B B B B B b B Example topologies
Spatial analysis • We assume nodes uniformly distributed in the area • We compute the occurrence probability of each scenario • We discard the case in which flows are completely isolated from each other normalized probabilities • insensitive to area size (no border effects) • insensitive to node density
Scenario Likelihood 0.8 scenario 2 scenario 3 0.7 scenario 4 scenario 5 scenario 6 0.6 scenario 7 scenario 8 scenario 9 0.5 scenario 10 scenario 11 Probability (conditioned) 0.4 scenario 12 0.3 0.2 0.1 0 0.1 0.2 0.3 0.4 0.5 0.6 0.7 0.8 0.9 1 Normalized distance between tx and rx
Performance simulations with CSMA/CA protocol X = two-way handshake Throughput measurements every 400 ms = four-way handshake
A B Ab aB a b A B A B A B A B Ab aB aB aB a b a b a b a b ab ab Scenarios classification : 3 groups AB A B Senders Connected (SC) a b Symmetric Incomplete State (SIS) Asymmetric Incomplete State (AIS)
Probabilities of 3 groups of scenarios 1 SC 0.9 AIS 0.8 SIS 0.7 0.6 0.5 Probability (conditioned) 0.4 0.3 0.2 0.1 0 0.1 0.2 0.3 0.4 0.5 0.6 0.7 0.8 0.9 1 Normalized distance between tx and rx
Hop distance distribution in a multi-hop network 300 nodes - 2000 m x 2000 m – Random waypoint – DSDV 0.5 Most of actively used hops are close to the maximum TX range ! 0.4 0.3 Probability 0.2 0.1 0 0 0.1 0.2 0.3 0.4 0.5 0.6 0.7 0.8 0.9 1 Hop distance / TX range
1 SC 0.9 AIS 0.8 SIS 0.7 0.6 0.5 Probability (conditioned) 0.4 0.3 0.2 0.1 0 1 1.5 2 2.5 3 Ratio between sensing range and transmission range Probabilities of 3 groups of scenarios Hop distance = TX range ; variable Sensing Range
a a A A b B b B Analysis of Asimmetric Incomplete State scenarios(AIS) B A a a A B b b • Known to be highly problematic for random access protocols: flow A a starves • V. Bharghavan, A. J. Demers, S. Shenker, L. Zhang, MACAW: A Media Access Protocol for Wireless LAN's, SIGCOMM ‘94 • RTS/CTS does not solve the problem • RRTS does not help • Not yet modeled analytically
Decoupling technique (valid for general topologies) • The channel “private view” of a node: channel is busy because of activity of other nodes Node’s transmission collides Node’s transmission is successful idle slot … t … • Modelled as a renewal-reward process P [event Ts occurs] Throughput (pkt/s) = Average duration of an event (s)
a a A A b B b B Analysis of Asimmetric Incomplete State scenarios(AIS) B A a a A B b b • Flow A a does not know when to contend: it has to discover an available gap in the activity of flow B b randomly, where to place an entire RTS or DATA packet RTS/DATA ? A a … … B b B b B b B b t
Analysis of Asimmetric Incomplete State scenarios(AIS) A a B b B b B b A a B b B b B b A a B b B b B b • The collision probability of flow A a can be accurately computed assuming that the first packet arrives at a random point in time • The collision probability of flow B bis zero
AIS scenario – model vs simulation with RTS/CTS basic access (no RTS/CTS) ns - Flow B ns - Flow B 1000 1000 model - Flow B model - Flow B 800 800 600 600 Packet Throughput (pkt/s) 400 400 ns - Flow A ns - Flow A 200 200 model - Flow A model - Flow A 0 0 200 400 600 800 1000 1200 1400 200 400 600 800 1000 1200 1400 Data Payload Size (bytes)
AIS scenario – model vs simulation Flow A backlogged – Flow B not backlogged 500 ns - Flow B 450 model - Flow B 400 350 300 Packet Throughput (pkt/s) 250 200 150 ns - Flow A model - Flow A 100 50 0 0 100 200 300 400 500 600 Arrival rate of flow B (pkt/s)
AP a a a A A A B b b b B B Analysis of Symmetric Incomplete State scenarios(SIS) • Long term fair, but short term unfair • One flow dominates over the other, until they switch their role (randomly) • RTS/CTS does not help, and can even make things worse • Not yet modeled analytically • As a special case, the receiver can be in common: = the classic “hidden-terminal” scenario
RTS/CTS – 9 backoff stages 50 45 40 35 30 25 20 15 10 5 0 50 51 52 53 54 55 56 57 58 59 60 Time (s) basic access – 4 backoff stages basic access – 7 backoff stages 50 50 45 45 40 40 35 35 30 30 25 throughput during 100 ms 25 20 20 15 15 10 10 5 5 0 0 50 51 52 53 54 55 56 57 58 59 60 50 51 52 53 54 55 56 57 58 59 60 Time (s) Simulation of short term unfairness – SC vs SIS RTS/CTS – 7 backoff stages 50 45 40 35 30 throughput during 100 ms 25 20 15 10 5 0 50 51 52 53 54 55 56 57 58 59 60 Time (s) Time (s)
a a a A A A B b b b B B Analysis of Symmetric Incomplete State scenarios(SIS) • To capture short-term behavior, we cannot apply the decoupling technique (independent states) • States of the two flows are tightly correlated ! • We use a markov model in which the state is: • The computation of the collision probability is the key point { backoff stage of A, backoff stage of B}
Analysis of Symmetric Incomplete State scenarios(SIS) • Steady-state distribution of Markov Chain: Time-scale of short term unfairness 0.16 0.14 0.12 0.1 Probability 0.08 0.06 0.04 0.02 0 0 1 2 0 3 1 4 stage B 2 3 5 4 5 6 stage A 6
SIS scenario – model vs simulation ns model ns model ns model ns model
Event probabilities: Modeling Media Access • Define the probabilities =probability that the node sends out a packetin a slot = conditional collision probability = conditional busy channel probability … … t
Modeling Media Access (a decreasing function of p ) • The unknown variables are: • Throughput formula: • The throughput of a node decreases if either: • is large (if so, is small, also) • is large (large fraction of busy time)
Short term unfairness – simulation 50 SC 45 SIS 40 35 30 25 throughput during 100 ms 20 15 10 5 0 50 51 52 53 54 55 56 57 58 59 60 Time (s)
50 45 40 35 30 25 throughput during 100 ms 20 15 10 5 0 50 51 52 53 54 55 56 57 58 59 60 Time (s) Short term unfairness – simulation SC SIS
50 45 40 35 30 throughput during 100 ms 25 20 15 10 5 0 50 51 52 53 54 55 56 57 58 59 60 Time (s) Short term unfairness – simulation SC SIS
Short term unfairness – simulation 50 SC 45 SIS 40 35 30 throughput during 100 ms 25 20 15 10 5 0 50 51 52 53 54 55 56 57 58 59 60 Time (s)