Download
1 / 52
520 likes | 625 Views
Genetic Epidemiological Strategies in the Search for Genes Tuan V. Nguyen University of New South Wales Faculty of Medicine. Genes and Diseases. Many diseases have their roots in gene and environment.

E N D
Genetic Epidemiological Strategiesin the Search for GenesTuan V. NguyenUniversity of New South WalesFaculty of Medicine
Genes and Diseases • Many diseases have their roots in gene and environment. • Currently, >4000 diseases, including sickle cell anemia and cystic fibrosis, are known to be genetic and are passed on in families.
Genes and Medical Sciences The central question for the medical sciences is the extent to which it will be possible to relate events at the molecular level with the clinical findings or phenotypes of patients with particular diseases.
Contents • Genes and DNA • Detection of genetic effects • Search for specific genes
Chromosomes Each human cell contains 23 pairs of chromosomes (distinguished by size and banding pattern). This is for males. Females have two XX chromosomes
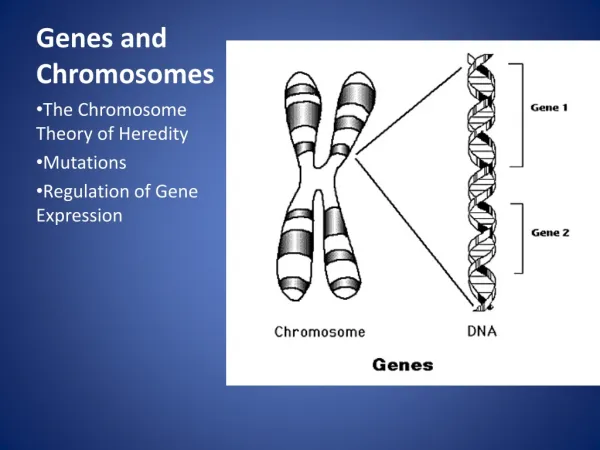
DNA and Genes • DNA carries the instructions that allow cells to make proteins. • DNA is made up of 4 chemical bases (A, T, G, C). • The bases make “words”: AGT CTC GAA TAA • Words make “sentence” = genes: < AGT CTC GAA TAA>
Genes, Alleles, and Genotypes • Location of a gene is called locus. • Alleles are alternate forms of a gene. Example: A, a • Genotype: the maternal and paternal alleles of an individual at a locus defines the genotype of the individual at that locus. Example: AA, Aa, aa.
How Do Genes Work? • Genes tell cell how to make molecules, called proteins. • Protein allows cells to perform specific functions. • If the instructions are fine, things will be normal. If the instructions are changed (mutated), abnormality will be resulted.
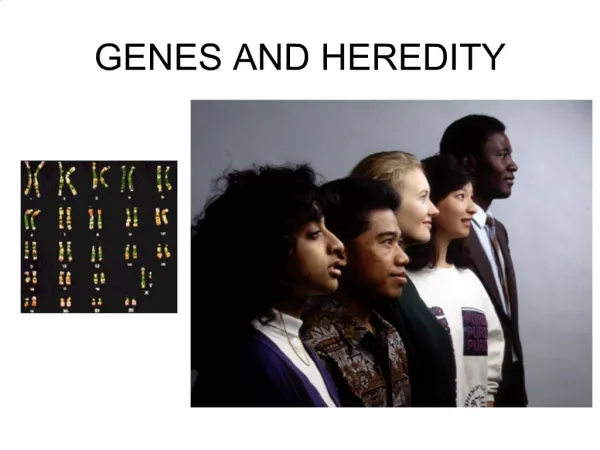
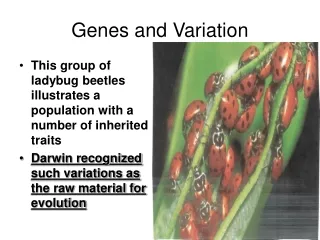
Inheritance • The passing of genes from parents to child is the basis of inheritance. • We are not identical to our parents: half of our genes are from our mothers and half from our fathers. • Each brother and sister inherits different combination of chromosomes. N = 2^23 = 8,388,608 combinations. • Identical twins receive exactly the same combination of genes from their parents.
Genetic effects • Three types of gene action: additive, dominant,and epistasis. • Additive effect. • AA: 9, Aa = 7, aa = 5. • Dominant effect. • AA: 9, Aa = 9, aa = 5. • Epistasis: interaction of alleles ar 2 loci • For locus 1: AA: 9, Aa = 7, aa = 5. • For locus 2: AA: 5, Aa = 5, aa = 9.
Clues to Genetics and Environment Epidemiol characteristics Genetics Environment Geographic variation + + Ethnic variation + + Temporal variation - + Epidemics +/- + Social class variation - + Gender variation + + Age +/- + Family variables History of disease + + Birth order +/- + Birth interval - + Co-habitation - +
Methods of Investigation of Genetic Traits • Family studies. Examine phenotypes (diseases) in the relatives of affected subjects (probands). • Twin studies. Examine the intraclass correlation between MZ (who share 100% genotypes) and DZ twins (who share 50% genotypes). • Adoption studies. Seek to distinguish genetic from environmental effects by comparing phenotypes in children more closely resemble their biological than adoptive parents. • Offspring of discordant MZ twins. Control for environmental effect; test for large genetic contribution to etiology.
Basic Genetic-Environmental Model Phenotype (P) = Genetics + Environment Genetics = Additive (A) + Dominant (D) Environment = Common (C) + Specific (E) => P = A + D + C + E
Statistical Genetic Model Cov(Yi,Yj) = 2Fijs2(a) + Dijs2(d) + gijs2(c) + dijs2(e) Fij : kinship coefficient Dij : Jacquard’s coefficient of identical-by-descent gij : Probability of sharing environmental factors dij : Residual coefficient VP = VA + VD + VC + VE V = variance; P = Phenotype; A, D, C, E = as defined
Kinship coefficients Expected coefficient for Relative s2(a) s2(d) s2(c) Spouse-spouse 0 0 1 Parent-offspring 1/2 0 1 Full sibs 1/2 1/4 1 Half-sibs 1/4 0 1 Aunt-niece 1/4 0 1 First cousins 1/8 0 0 Dizygotic twins 1/2 1/4 1 Monozygotic twins 1 1 1
Heritability (H2) Cov(Yi,Yj) = 2Fijs2(a) + Dijs2(d) + gijs2(c) + dijs2(e) VP = VA + VD + VC + VE Broad-sense heriatbility: H2 = (VA+ VD) / VP Narrow-sense heriatbility: H2 = VA / VP
Statistical Methods for Estimating Heritability • Simple linear regression Yoffp = b(Yp ) + e H2 = 2b • Twin concordance Intraclass correlation: rMZ and rDZ H2 = 2(rMZ - rDZ) • Path analysis and variance component model
Path Model for Twin Data r = 1 r = .5 / .25 r = 1 / .5 E1 C1 D1 A1 A2 D2 C2 E2 a c d e a d c e Twin 1 Twin 2 A=additive; D=dominant; C=common environment; E=specific environment
Intraclass Correlation: Femoral neck bone mass DZ MZ rMZ = 0.73 rMZ = 0.47
Genetic Determination of Lean, Fat and Bone Mass rMZ, rDZ : Intraclass correlation for MZ and DZ twins
Multivariate Analysis: The Cholesky Decomposition Model G1 G2 G3 G4 G5 Fat mass LS BMD FN BMD TB BMD Lean mass E1 E2 E3 E4 E5 LS=lumbar spine, FN=femoral neck, TB=total body, BMD = bone mineral density
Genetic and Environmental Correlation between Lean, Fat and Bone Mass
How many genes? • Initial estimate: 120,000. • DNA sequence: 60,000 - 70,000. • HGP: 32,000 - 39,000 (including non-functional genes = inactive genes).
Distribution of the number of genes Polygenes Number of genes Oligogenes Major genes Effect size
Finding genes: a challenge One of the most difficult challenges ahead is to find genes involved in diseases that have a complex pattern of inheritance, such as those that contribute to osteoporosis, diabetes, asthma, cancer and mental illness.
Why Search for Genes? • Scientific value • Study genes’ actions at the molecular level • Therapeutic value • Gene product and development of new drugs; • Gene therapy • Public health • Identification of “high-risk” individuals • Interaction between genes and environment
Genomewise screening vs Candidate aene approach • Genomewise screening • No physiological assumption • Systematic screening for chromosomal regions of interest in the entire genome • Candidate gene • Proven or hypothetical physiological mechanism • Direct test for individual genes
Linkage vs Association • Linkage • Transmission of genes within pedigrees • Association • Difference in allele frequencies between cases and unrelated controls
Statistical models • Linkage analysistraces cosegregation and recombination phenomena between observed markers and unobserved putative trait. Significance is shown by a LOD (log-odds) score. • Association analysis compares the frequencies of alleles between unrelated cases (diseased) and controls. • Transmission disequilibrium test (TDT) examines the transmission of alleles from heterozygous parents to those children exhibiting the phenotype of interest.
Two-point linkage analysis: an example D 142 138 /142 D 142 d 134 ?? 134 /142 146 / 154 142 /146 142 /154 134 / 146 142 / 154 134 / 146 134 / 154 134 / 146 134 / 154 Non Rec Non Non Non Non Rec Non Non = non-recombination; Rec = recombination
No linkage Complete linkage D d D d 1/4 1/4 0 1/2 134 142 134 142 1/4 1/4 1/2 0 Incomplete linkage D d q/2 (1-q)/2 134 142 (1-q)/2 q/2
Estimation of q Max LOD score +6 +4 LOD score +2 0 -2 -4 -6 0 0.1 0.2 0.3 0.4 0.5 Estimated value of q
Basic linkage model LR: likelihood ratio LR(q) = L(data | q) / L(data | q = 0.5) LOD = Log10 max [LR(q)]
Haseman-Elston model(allele sharing method) Xi1 = value of sib 1; Xi2 = value of sib 2 Di = abs(Xi1 - Xi2)2 pi = probability of genes shared identical-by-descent E(Di | pi) = a + b pi If b = 0 => s2(g) = 0; q = 0.5, i.e. No linkage If b < 0 => s2(g) > 0; q ne 0.5, i.e. Linkage Behav Genet 1972; 2:3-19
Identical-by-descent (IBD) 126 / 130 134 / 138 126 / 134 126 / 138 130 / 134 130 / 138 126 / 138 A B C D E Alleles ibd if they are identical and descended from the same ancestral allele • A and D share no alleles • A, B and E share 1 allele (126) ibd; C vs D; A vs C; B, D and E • B and E share 2 (126 and 138) alleles ibd
Identical-by-state (IBS) 126 / 126 126 / 138 126 / 126 126 / 138 126 / 138 126 / 126 A B C D Alleles ibs if they are identical, but their ancestral derivation is unclear • A and D share 1 allele (126) ibs • B and C share 126 ibs, 138 ibd
Sibpair linkage analysis: allele-sharing method Squared difference in BMD among siblings o o o o o o o o o o o o o o o o o o o o o o o o o o o 0 1 2 Number of alleles shared IBD
Linkage between VDR gene and lumbar spine bone mineral density in a sample of 78 DZ twin pairs. Nature 1994; 367:284-287
Association analysis • Presence/absence of an allele in a phenotype. Genotype Fx No Fx BB 50 10 Bb 30 30 bb 20 60 Total 100 100 Frequency of allele B among fx: (50x2 + 30) / (100x2) = 0.65 Freq. of allele B among no fx: (10x2 + 30) / (100x2) = 0.25
Association analysis: an example Association between vitamin D receptor gene and bone mineral density
Association analysis • Three conditions of association • The genetic marker is the putative gene • The marker is in linkage disequilibrium (association) with the putative gene or with a nearby locus • Random artefact, population admixture
Linkage and association • Linkage without association • Many trait-causing loci • Association between a marker and a loci can be weak or absent • Association without linkage • A minor effect of the genetic marker • Poor discriminant power for phenotype within a pedigree
Statistical issues Statistical reasoning Null hypothesis (Ho) is Stat test Not true True ______________________________________________ Reject Ho No error Type I (a) Accept Ho Type II (b) No error ______________________________________________ Diagnostic reasoning Disease is really Test Present Absent ______________________________________________ +ve True +ve False +ve -ve False -ve True -ve ______________________________________________ Study design: minimize type I and type II errors
No. of sibpairs required to establish linkage for a single gene and recombination = 0 l LOD = 3 LOD = 4 1.1 7460 8931 1.2 2048 2566 1.3 1033 1299 1.5 489 615 2.0 199 242 1.5 191 154 3.0 88 115 l = familial relative risk
Strategies for improvement of power • Population and sampling • Phenotypes • Statistical analysis
Population and sampling • Population • Homogenous populations • Sampling units • Related members • Large, multigenerational families (rather than sibpairs) • Phenotypes • Low-level, intermediate • Well-defined and highly reproducible
Statistical analyses • Multivariate analysis vs. univariate analysis • Variance component model • Power • Locus-specific power:probability of detecting an individual locus associated with the trait, e.g. 1-bi • Genomewide power: probability of detecting any of the k loci, e.g. 1-b1x b2x b3x … x bk • Studywise power: probability of detecting all k loci, e.g. (1-b1) x (1-b2) x (1-b3) x ... x (1-bk)
Summary • Most diseases are regulated by genes and environment. • Genetic dissection of multifactorial diseases is a challenge. • Gene-hunting is a major endeavour in epidemiological research. • Substantial progress in statistical models.