Download

1 / 14
140 likes | 369 Views
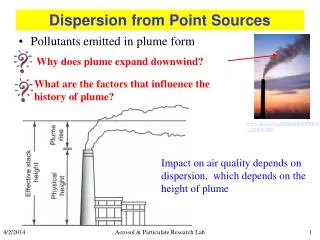
Point Sources Progress Reporting. Management Board Conference Call February 9, 2012. Nutrient Reductions Progress Reporting. Annual Progress Report: The annual progress report should assess the success of the implementation efforts from the preceding year’s action plan.

E N D
Point Sources Progress Reporting Management Board Conference Call February 9, 2012
Nutrient ReductionsProgress Reporting • Annual Progress Report: The annual progress report should assess the success of the implementation efforts from the preceding year’s action plan. • Indicator: A valid indicator of progress must hold constant everything except the change that is being measured. • Issue: The point source progress measure is not measuring implementation progress, it is measuring the combined influence of progress and flow. • By not accounting for WWTP flow, an understanding of progress is confounded.
2010 Status Report Nutrient Loads Delivered to the Bay • Loads delivered to the Bay over past year • Influenced by precipitation. • The existing indicator should be retained as the primary indicator, and as an indicator of status. • Chart Source: EPA Chesapeake Bay Program
Current Progress Reporting Approach • Inconsistent approach for point and nonpoint source indicators. • EPA reports non-point source nutrient reductions progress based on the watershed model that uses a 10 year hydrologic averaging period that is applied to the most recent implementation efforts • This approach reduces the influence of annual variation in flow and provides a better indication of “on the ground” progress.
Current Progress Reporting ApproachPoint Sources • EPA reports point source progress based on most recent year information from Discharge Monitoring Reports (DMRs). • Flows vary with precipitation due to infiltration and inflow (I & I) into the collection system • Because of this, the current progress indicator is confounded by flow changes caused by precipitation that varies annually, thus masking reductions (or increases) in effluent concentrations. • This is not an accurate progress report for decision makers or the public.
Point Sources Progress Reporting Issues/Concerns: • How to make PS and NPS comparable in Progress Scenarios, Milestones, Bay Barometer. • The influence of annual variation in precipitation or any other confounding factor must be removed from both. • Follow up with 2009 Executive Council decision to report “Practices in Place.”
Point Sources Progress Reporting Actions Requested: • Provide feedback on proposed supplemental indicators for PS progress reports (e.g., nutrients concentrations, # of upgraded facilities) • Provide feedback on methodology to estimate PS loads for Progress reports; decide on flow averaging period • Prepare to present issue to PSC if necessary.
Point Sources CY2000-2010 Flows Example of Flow used in Current Progress Reporting Are we comparing Apples and Oranges? Qave Nonpoint Sources NPS Averaging Period PS Avereraging Period Qave Point Sources
Precipitation and Growth • There are two signals from flow: • “Random noise” from natural variation in precipitation. • An increasing trend from growth. • The noise should be factored out to clarify progress. • The increase due to growth is an important factor that should be made apparent. • Growth • Load differences in similar flow years can be attributable to growth and are consistent with estimates of population growth and EDUs from the Maryland Department of Planning. • However, TN Load decreased reflecting WWTP upgrades and showing Progress. • In wet years, this Progress is masked by rainfall.
Precipitation, WWTP Flows and Growth Maryland Annual Average Precipitation CY* 2000 - 2010 Precip = 45.77 inches 2008 2001 Precip = 37.43 inches 2007 Precip = 37.62 inches WWTP Annual Flows CY* 2000 - 2010 2007 WWTP Flow = 536 mgd TN Load 12.67 M lb 2008 WWTP Flow = 592 mgd TN Load 13.25 M lb 2001 WWTP Flow = 515 mgd TN Load = 14.94 M lb *The charts above were developed using calendar year data, and are presented with the purpose of showing the correlation between rainfall and WWTP flows
Flows vs Loads – Major WWTPs Annual Flows for Major WWTPs • Annual TN Load for Major WWTPs: • Significant reduction after 2005 • Reflecting ENR upgrades • Load is reduced despite increase flows from hookups or growth, but progress is hidden by rainfall
Flows vs TN Concentrations – Major WWTPs Annual Flows for Major WWTPs Facilities Annual Flow Weighted TN Concentrations Trend – When presentation is flow-weighted, the trend becomes apparent.
Flows vs TP Concentrations – Major Facilities Annual Flows for Major WWTPs Facilities Annual Flow Weighted TN Concentrations Trend – When presentation is flow-weighted, the trend becomes apparent.
Conclusion • The 2009 Executive Council (EC) intended to measure progress of implementation (report “Practices in Place”) • Current indicator does not show Progress because: • It is confounded by rainfall • Is inconsistent with NPS progress reporting • Progress reporting requires a consistent flow averaging period for both PS and NPS • If current indicator is retained, other indicators not confounded by rainfall are needed, including: • WWTP performance (Nutrient concentrations) • Normalized or average flows for load estimates • Number of facilities upgraded