Download
1 / 17
170 likes | 253 Views
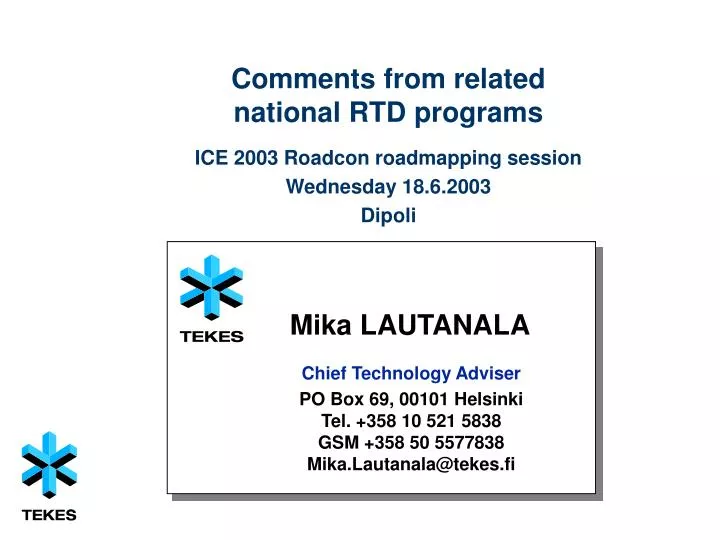
Mika LAUTANALA. Chief Technology Adviser PO Box 69, 00101 Helsinki Tel. +358 10 521 5838 GSM +358 50 5577838 Mika.Lautanala@tekes.fi. Comments from related national RTD programs. ICE 2003 Roadcon roadmapping session Wednesday 18.6.2003 Dipoli. Business Angels 380. From abroad 115.

E N D
Mika LAUTANALA Chief Technology Adviser PO Box 69, 00101 Helsinki Tel. +358 10 521 5838 GSM +358 50 5577838 Mika.Lautanala@tekes.fi Comments from related national RTD programs ICE 2003 Roadcon roadmapping session Wednesday 18.6.2003 Dipoli
Business Angels 380 From abroad 115 Venture capitalists: Private 287 Industry Investment Ltd 38 (42) Sitra 64 VTT 214 (68) Finnvera 332 (44) Tekes 386 Finpro 55 (30) Academy of Finland 184 Innofin 5 (4) Ministries,TE-Centres,sectorial research287 (209) Universities 834 (364) Innovation systemResources and funding in 2001 R&Dat companies 3,284 Private Public Business developmentMarketing Internationalisation Basic research Applied research Business R&D The figures represent the total extent of each organisation in million euros in 2001. In parenthesis the share that is funded from the State budget. The funds of Tekes, the Academy of Finland and Innofin are funded entirely from the State budget.
R&D input in some OECD countries Percentage of GDP 4.5 Israel Sweden 4.0 FINLAND Japan 3.5 Iceland USA 3.0 South Korea Germany 2.5 OECD total France Singapore 2.0 Denmark Canada 1.5 Great Britain Austria 1.0 Norway China 0.5 est. Sources: OECD, Main Science and Technology Indicators database,Statistics Finland (Finland 2002) and Statistiska centralbyrån (Sweden 2001, estimate).
Competitiveness by country Ranking by IMD USA FINLAND Luxembourg Netherlands Singapore Denmark Switzerland Canada Hong Kong Ireland Sweden Germany Norway France Japan 1997 1998 1999 2000 2001 2002 Source: The World Competitiveness Yearbook
2 1 .. 8 4 14 15 3 13 11 9 16 17 20 21 1 6 3 4 2 14 10 7 8 5 13 24 15 22 21 2 11 7 9 1 17 6 5 3 10 19 18 25 23 14 2 1 .. 3 10 8 5 11 18 22 6 16 4 12 15 2 1 .. 4 9 6 5 11 16 22 7 17 3 15 14 1 2 .. 3 12 7 5 8 21 17 4 22 6 9 14 Competitiveness scoreboard Total ranking IMDTotal competitiveness WEFTotal growth competitiveness WEFCurrent competitiveness 2002 2001 2000 1999 2001 2000 1999 2001 2000 1999* USA FINLAND Luxembourg Netherlands Singapore Denmark Switzerland Canada Hong Kong Ireland Sweden Iceland Germany France Japan 1 2 3 4 5 6 7 8 9 10 11 12 15 22 30 1 3 4 5 2 15 10 9 6 7 8 13 12 25 26 1 4 6 3 2 13 7 8 12 5 14 9 11 22 24 1 5 3 4 2 9 7 10 6 8 14 13 12 23 24 * Based on earlier competitiveness index of micro economy Sources: The World Competitiveness Yearbook (IMD) and The Global Competitiveness Report (WEF)
IMD WEF UNDP 2001 2 3 1 .. 9 8 .. 12 10 6 13 .. 11 4 17 Competitiveness comparison Ranking by the science and technology factor Techno- Scienti-logical fical infrastructure Science and technology 2001 2001 2000 1999 1998 1997 2001 2000 1999 USA Sweden FINLAND Iceland Australia Canada Denmark Norway Singapore Netherlands Ireland Switzerland Germany Japan France 1 2 3 4 5 6 7 8 9 10 12 13 15 19 23 1 5 6 13 20 12 8 23 10 9 18 3 4 2 7 1 5 6 13 18 16 10 15 9 8 17 3 4 2 7 1 5 6 19 16 13 9 17 12 8 11 3 4 2 7 1 15 6 26 21 12 14 20 9 11 8 5 3 2 4 1 21 6 31 24 9 23 11 8 12 7 5 3 2 4 1 6 3 19 5 2 12 7 18 14 28 24 15 23 17 1 9 2 26 23 14 13 29 3 15 4 6 5 7 11 1 10 3 23 6 4 13 15 2 16 8 11 17 5 12 Sources: The World Competitiveness Yearbook (IMD), The Global Competitiveness Report (WEF) and Human Development Report (UNDP)
ProBuild Real Estate and Construction Cluster Real Estate BuildingConstruction Building Services INFRA Building material and product
Global Megatrends in RECC • The end users (companies and consumers) are becoming more and more global • real estate business has to become international (global) business • the whole RECC value chain has to harmonize globally standards, codes and even products • the whole RECC value chain has to network globally • real estate and construction business has to be more transparent • need of knowledge and data grows dramatically • information and communications technology (ICT) becomes core of the RECC business • innovation management will become the driving force of business network in RECC
RECC STRATEGY 2003-The New Mission The new mission of the Real Estate and Construction Cluster: • Real Estate and Construction Cluster provides the infrastructure and the platform for: • global success of all businesses and • well-being of the society • The cluster itself measures the benefits the value network offers to the end user
97 98 99 00 01 02 03 04 05 06 07 08 Technology programmes on construction Value Added Wood Chain Rembrand Infra CUBE Industrialised Building Construction1987-1991 Vera Sara Healthy Building Simulation Stone Divan ProBuild SamBa FinnSteel Environmental tech. construction Wood construction
Vera Program Target Information Networking in the Construction Process The target is to promote the implementation and use of ICT and networks as the enabling technologies to re-engineer the design, construction and FM processes Development of the AEC/FM Processes Efficient Use of the Information Networks SYNERGY Implementation of ICT in the Value Chain Information Sharing Life Cycle Information Management
Programme organisation Vision • Steering Board • Lauri Ratia, chair • Mika Halttunen • Markku Hautanen • Kari Inkinen • Erkki KM Leppävuori • Juhani Sormaala • Mika Lautanala Programme Manager Publid research projects • Tekes • preparation • co-ordination • decisions Researchfunding SARA programme Synergy Networking Funding Grants Loans Capital loans Private development projects
Porter Value Chain 1 2 3 4 5 As-is • Cost based competition • Business process driven by lowest cost • User needs neglected • Does not promote innovations • Suboptimization
2 1 5 4 3 Value Network To-be • Performance and quality based competition • Business process driven by customer perceived value • User needs control the process • Encourages to innovations • Total optimisation • Transparency and partnering
Design Manu-facturing Contracting Process orientation Trans-portation Sub-contracting
Thank You! www.tekes.fi/english/programmes/sara/

![Some Stuxnet Related Comments [excerpted from a longer presentation]](https://cdn0.slideserve.com/1152501/some-stuxnet-related-comments-excerpted-from-a-longer-presentation-dt.jpg)


![Some Stuxnet Related Comments [excerpted from a longer presentation]](https://cdn5.slideserve.com/9358763/some-stuxnet-related-comments-excerpted-from-a-longer-presentation-dt.jpg)