Download
1 / 1
10 likes | 112 Views
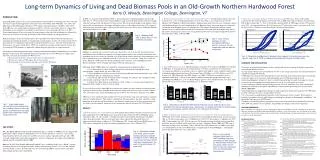
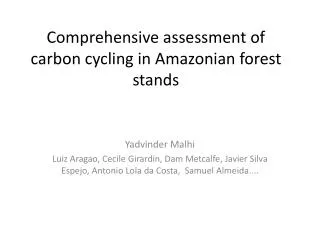
Carbon Balance and Vegetation Dynamics in an Old-growth Amazonian Forest L. Hutyra 1 , A.H. Rice 1 , E. Hammond-Pyle 1 , S.R. Saleska 1 , K. Portilho 2 , D. Ferreira 2 , P.B. de Camargo 2 , S.C. Wofsy 1 1 Dept. of Earth & Planetary Sciences, Harvard University; 2 CENA/USP, Piracicaba, SP.

E N D
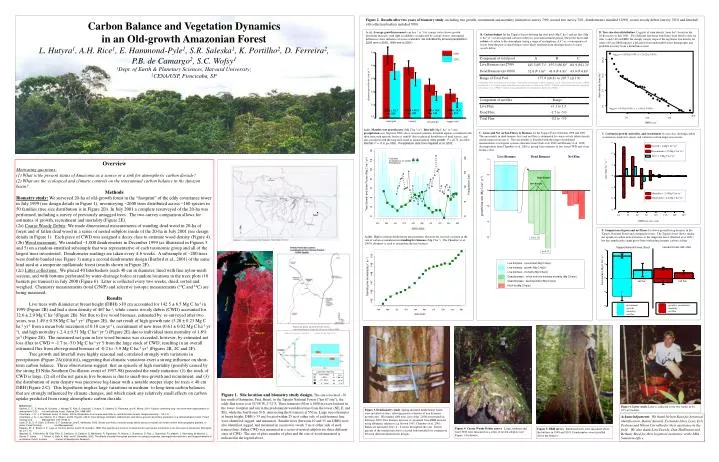
Carbon Balance and Vegetation Dynamics in an Old-growth Amazonian Forest L. Hutyra1, A.H. Rice1, E. Hammond-Pyle1, S.R. Saleska1, K. Portilho2, D. Ferreira2, P.B. de Camargo2, S.C. Wofsy1 1Dept. of Earth & Planetary Sciences, Harvard University; 2CENA/USP, Piracicaba, SP 3 Growth = 3 Mg C ha-1yr-1 Recruitment = 2.8 Mg C ha-1yr-1 2 Net = 1.2 Mg C ha-1yr-1 1 flux, MgC ha-1 yr -1 0 -1 Mortality = -2.4 Mg C ha-1yr-1 Outgrowth = -2.2 Mg C ha-1yr-1 -2 log10y= -0.058(± 0.003) x + 2.912(± 0.076) -3 35 60 85 110 135 160 185 10 100.0 DBH size class (cm) 10.0 1.0 0.1 log10y= -0.016(± 0.001) x + 1.451(± 0.064) 50 100 150 14 20 Total litter 12 Chambers et al. (2000) Precipitation 4 10 15 high density 8 Tree Growth and Litter Fluxes(Mg C ha-1 yr-1) low density Precipitation (cm) 2 10 6 growth/loss rate (Mg C ha-1 yr-1) 4 5 0 2 0 0 -2 Jan Apr Jul Oct Jan Apr Jul Oct Jan Apr 2000-2002 -4 k=0.17 -6 150 k=0.13 Live biomass - recruitment (Mg C/ha/yr) 149 Live biomass - growth (Mg C/ha/yr) Live biomass - mortality (Mg C/ha/yr) 148 Dead biomass - inflow from live biomass mortality (Mg C/ha/yr) Standing live biomass(Mg C ha-1) Dead biomass - decomposition (Mg C/ha/yr) 147 Net Flux(Mg C/ha/yr) 146 145 Jan Apr Jul Oct Jan Apr Jul Oct Jan Apr 2000-2002 Figure 2.Results after two years of biometry study, including tree growth, recruitment and mortality (initial tree survey 7/99, second tree survey 7/01, dendrometers installed 12/99), coarse woody debris (survey 7/01) and litterfall (40 collection baskets installed 7/00). A. (i).Average growth increment (cm tree -1 yr-1) by canopy status shows growth increment increases with light availability (as indicated by canopy status), interannual differences show influence of water availability (as indicated by annual precipitation: 2200 mm in 2000, 1846 mm in 2001). D. Tree size-class distribution, Log plot of stem density (trees ha-1) based on the 20-ha survey in July 2001. Two different log-linear trend lines were fitted to data for trees > and < 40 cm DBH, the sharply steeper slope of the log-linear tree density for stems <40 cm DBH suggests a deviation from undisturbed forest demography and probable recovery from a disturbance event. B. Carbon budget for the Tapajos Forest showing the total pool (Mg C ha-1) and net flux (Mg C ha-1 yr-1) of aboveground carbon for the two-year measurement period. The forest shows net release of carbon to the atmosphere (using a range of assumptions, A-C) as a consequence of losses from the pool of dead biomass most likely resulting from decomposition of coarse woody debris. 0.5 2000 Component of total pool A B C 2001 ± ± ± Live Biomass (n=2799) 145.3 ( 5.7)1 155.5 ( 8.8)2 161.9 ( 11.3)3 0.4 ± ± ± Dead Biomass (n=1000) 32.6 ( 3.6)4 41.4 ( 4.8)5 43.8 ( 4.8)6 Range of Total Pool 177.9 (±6.8) to 205.7 (±11.9) 0.3 1 Allometry from Chambers et al. (2000), 2 Allometry from Brown (1997), equation 3.2.3, 3Allometry from Brown (1997), equation 3.2.4, 4Carbon mass calculated from densities in Clark et al. (2002), 5Carbon mass calculated from densities in Delaney et al. (1998), 6Carbon mass calculated from densities in Summers (1998). diameter growth rate (cm yr-1) stem density trees ha-1 0.2 Component of net flux Range 0.1 Live Flux +1.1 to 1.5 DBH = 35.2 n = 261 DBH = 19.8 n = 149 DBH = 15.9 n = 214 DBH = 73.7 n = 239 Dead Flux -1.7 to -5.0 200 0.0 Total Flux -0.2 to -3.9 emergent canopy suppressed subcanopy DBH in cm A.(ii). Monthly tree growth rates (Mg C ha-1 yr-1), litterfall (Mg C ha-1 yr-1) and precipitation (cm, Nepstad, 2002) show seasonal variation. Litterfall appears correlated in the short term with episodic bursts of rainfall (due to physical disturbance of dead leaves), and anti-correlated with the long-term trend in annual rainfall (tree growth: r2 =+0.71, p<.001; litterfall: r2 = -0.4, p<.005). Precipitation data from Nepstad et al. 2002. C. Gross and Net carbon Fluxes to Biomass for the Tapajos Forest between 1999 and 2001. The uncertainty in dead biomass loss (and net flux) is dominated by coarse woody debris density and decomposition rate, k. This uncertainty is bounded with the range of published measurements for tropical systems (densities from Clark et al. 2002 and Delaney et al. 1998; decomposition from Chambers et al. 2001a), giving four estimates of loss from CWD and of net biomass flux. E.Carbon in growth, mortality, and recruitment by size class showing carbon accretion in small size classes and carbon loss from larger size classes. Live Biomass Dead Biomass Net Flux • Overview • Motivating questions: • (1) What is the present status of Amazonia as a source or a sink for atmospheric carbon dioxide? • (2) What are the ecological and climatic controls on the interannual carbon balance in the Amazon basin? • Methods • Biometry study: We surveyed 20-ha of old-growth forest in the “footprint” of the eddy covariance tower in July 1999 (see design details in Figure 1), inventorying ~2600 trees distributed across ~160 species in 50 families (tree size distribution is in Figure 2D). In July 2001 a complete resurveyed of the 20-ha was performed, including a survey of previously untagged trees. The two-survey comparison allows for estimates of growth, recruitment and mortality (Figure 2E). • (2a) Coarse Woody Debris: We made dimensional measurements of standing dead wood in 20-ha of forest and of fallen dead wood in a series of nested subplots inside of the 20-ha in July 2001 (see design details in Figure 1). Each piece of CWD was assigned a decay class to estimate wood density (Figure 4). • (2b) Wood increment: We installed ~1,000 dendrometers in December 1999 (as illustrated in Figures 3 and 5) on a random-stratified subsample that was representative of each taxonomic group and all of the largest trees inventoried. Dendrometer readings are taken every 4-6 weeks. A subsample of ~200 trees were double-banded (see Figure 3) using a second dendrometer design (Barford et al., 2001) of the same kind used at a temperate midlatitude forest (results shown in Figure 2F). • (2c) Litter collections: We placed 40 litterbaskets (each 40 cm in diameter, lined with fine nylon-mesh screens, and with bottoms perforated by water-drainage holes) at random locations in the trees plots (10 baskets per transect) in July 2000 (Figure 6). Litter is collected every two weeks, dried, sorted and weighed. Chemistry measurements (total C/N/P) and selective isotopic measurements (13C and 14C) are being measured. • Results • Live trees with diameter at breast height (DBH) >10 cm accounted for 142.5 ± 6.5 Mg C ha-1 in 1999 (Figure 2B) and had a stem density of 467 ha-1, while coarse woody debris (CWD) accounted for 32.6 ± 2.9 Mg C ha-1 (Figure 2B). Net flux to live wood biomass, estimated by re-surveyed after two years, was 1.49 ± 0.58 Mg C ha-1 yr-1 (Figure 2E), the net result of high growth rate (3.28 ± 0.23 Mg C ha-1 yr-1 from a mean bole increment of 0.18 cm yr-1), recruitment of new trees (0.61 ± 0.02 Mg C ha-1 yr-1), and high mortality (-2.4 ± 0.51 Mg C ha-1 yr-1) (Figure 2E) due to individual stem mortality of 1.8% yr-1 (Figure 2E). The measured net gain in live wood biomass was exceeded, however, by estimated net loss (flux to CWD = -1.7 to -5.0 Mg C ha-1 yr-1) from the large stock of CWD, resulting in an overall estimated flux from aboveground biomass of -0.2 to -3.9 Mg C ha-1 yr-1 (Figures 2B, 2C and 2F). • Tree growth and litterfall were highly seasonal and correlated strongly with variations in precipitation (Figure 2A(i)(ii)(iii)), suggesting that climatic variations exert a strong influence on short-term carbon balance. Three observations suggest that an episode of high mortality (possibly caused by the strong El Niño Southern Oscillation event of 1997-98) preceded the study initiation: (1) the stock of CWD is large, (2) all of the net gain in live biomass is due to small-tree growth and recruitment, and (3) the distribution of stem density was piecewise log-linear with a notable steeper slope for trees < 40 cm DBH (Figure 2.C). This hypothesis implies large variations in medium- to long-term carbon balances that are strongly influenced by climate changes, and which mask any relatively small effects on carbon uptake predicted from rising atmospheric carbon dioxide. • References: • Barford, C. C., S. Wofsy, M. Goulden, J. Munger, E. Pyle, S. Urbanski, L. Hutyra, S. Saleska, D. Fitzjarrald, and K. Moore. 2001. Factors controlling long- and short-term sequestration of atmospheric CO2 in a mid-latitude forest. Science 294: 1688-1691. • Chambers, J. Q., J. P. Schimel, and A. D. Nobre. 2001a. Respiration from coarse wood litter in central Amazon forests. Biogeochemistry : 115-131. • Chambers, J. Q., J. dos Santos, R. J. Ribeiro, and N. Higuchi. 2001b. Tree damage, allometric relationships, and above-ground net primary production in a central Amazon forest. Forest Ecology and Management 152: 73-84. 8 • Clark, D. B., D. A. Clark, S. Brown, S. F. Oberbauer, and E. Veldkamp. 2002. Stocks and flows of coarse woody debris across a tropical rain forest nutrient and topography gradient. In press, Forest Ecology and Management. • Delaney, M., S. Brown, A. E. Lugo, A. Torres-Lezama, and N. B. Quintero. 1998. The quantity and turnover of dead wood in permanent forest plots in six life zones of Venezuela. Biotropica 30: 2-11. 10 • Nepstad, D., P. Moutinho, M. Dias-Filho, E. Davidson, G. Cardinot, D. Markewitz, R. Figueiredo, N. Vianna, J. Chambers, D. Ray, J. Guerreiros, P. Lefebvre, L. Sternberg, M. Moreira, L. Barros, F. Ishida, I. Tohlver, E. Belk, K. Kalif, and K. Schwalbe. 2002. The effects of partial throughfall exclusion on canopy processes, aboveground production, and biogeochemistry of an Amazon forest. In press ,Journal of Geophysical Research . Natal F. Comparison of gross and net fluxes for above ground living biomass in the Tapajós National Forest and a temperate forest. The Tapajós forest shows similar net uptake of carbon in live biomass to the temperate forest (Barford at al. 2001) but has significantly larger gross fluxes indicating dynamic carbon cycling. A.(iii). High resolution dendrometer measurements illustrate the seasonal variation in the rate of carbon accumulation in standing live biomass (Mg C ha-1). The Chambers et al. 2001b allometry is used to extrapolate the tree biomass. Harvard Forest, MA, USA Tapajós National Forest, Brazil 4 Rio Amazonas Santarém 2 live biomass, Mg C ha-1 yr-1 0 net flux net flux -2 Rio Tapajós recruitment growth + recruitment -4 growth mortality mortality net flux net flux Km 67 Biometry plots upwind of flux tower, with locations & sizes of all trees >35cm DBH Km 83 Map of the transects and tower Coarse Woody Debris Plot tower Legend for CWD Plots plot size of wood area # > 30cm 32 1200 m2 10 - 30 cm 64 25 m2 2 - 10 cm 64 1 m2 Figure 1. Site location and biometry study design.The site is located ~70 km south of Santarém, Pará, Brazil, in the Tapajós National Forest (“km 67 site”), the eddy-flux tower is at 54°58’W, 2°51’S. Three transects (50 m x 1000 m) were laid out in the tower footprint and run in the predominant wind directions from the tower (NE, E, and SE), while the fourth runs N-S, intersecting the E transect at 550 m. Large trees (diameter at breast height, DBH > 35 cm) located within 25 m of either side of each transect line were identified, tagged, and measured. Smaller trees (between 10 and 35 cm DBH) were also identified, tagged, and measured in a narrower swath, 5 m of either side of each transect line. Fallen CWD was measured in a series of nested subplots for three different sizes of CWD. The size of plots, number of plots and the size of wood measured is indicated in the legend above. Figure 6. Litter study. Litter is collected every two weeks in 64 0.15 m2 baskets. Figure 3. Dendrometry study. Spring-mounted dendrometer bands were installed on trees, allowing precise estimates of tree diameter growth rates. We banded 1000 trees (out of the ~2600 inventoried) in February 2000. Tree biomass increase is calculated from DBH increase using allometric relations (e.g. Brown1997, Chambers et al. 2001). Bands are measured every 4 – 6 weeks throughout the year. Twenty percent of the banded trees have a second band installed for comparison between different dendrometer designs. Acknowledgements. We thank Nelson Rosa for botanical identification, Daniel Amaral, Fernando Alves Leao, Erly Pedroso and Nilson Carvalho for their assistance in the field. We also thank Lisa Zweede, Dan Hodkinson and Bethany Reed for their logistical assistance at the LBA Santarem office. Figure 4. Coarse Woody Debris survey. Large, medium and fine CWD were measured in a series of nested subplots (see Figure 1 for details). Figure 5. DBH survey. Buttressed trees were measured above the buttress in 1999 and 2001. Dendrometers were installed above the buttress.