Download
1 / 23
230 likes | 628 Views
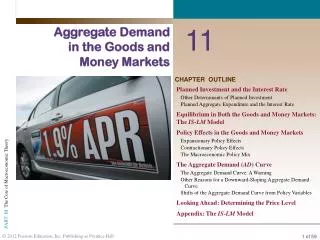
26. Aggregate Demand, Aggregate Supply, and Inflation. Chapter Outline.

E N D
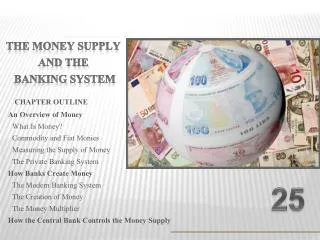
26 Aggregate Demand, Aggregate Supply, and Inflation Chapter Outline The Aggregate Demand CurveDeriving the Aggregate Demand CurveThe Aggregate Demand Curve: A WarningOther Reasons for a Downward-Sloping Aggregate Demand CurveAggregate Expenditure and Aggregate DemandShifts of the Aggregate Demand CurveThe Aggregate Supply CurveThe Aggregate Supply Curve: A WarningAggregate Supply in the Short RunShifts of the Short-Run Aggregate Supply CurveThe Equilibrium Price LevelThe Long-Run Aggregate Supply CurvePotential GDPAggregate Demand, Aggregate Supply, and Monetary and Fiscal PolicyLong-Run Aggregate Supply and Policy EffectsCauses of InflationInflation versus Sustained Inflation: A ReminderDemand-Pull InflationCost-Push, or Supply-Side, InflationExpectations and InflationMoney and InflationSustained Inflation as a Purely Monetary PhenomenonLooking Ahead
THE AGGREGATE DEMAND CURVE aggregate demand The total demand for goods and services in the economy. Money demand is a function of three variables: the interest rate (r), the level of real income (Y), and the price level (P). (Remember, Y is real output, or income. It measures the actual volume of output, without regard to changes in the price level.) Money demand will increase if the real level of output (income) increases, the price level increases, or the interest rate declines.
THE AGGREGATE DEMAND CURVE DERIVING THE AGGREGATE DEMAND CURVE FIGURE 13.1 The Impact of an Increase in the Price Level on the Economy–Assuming No Changes in G, T, and Ms
THE AGGREGATE DEMAND CURVE DERIVING THE AGGREGATE DEMAND CURVE aggregate demand curve (AD) A curve that shows the negative relationship between aggregate output (income) and the price level. Each point on the AD curve is a point at which both the goods market and the money market are in equilibrium. FIGURE 13.2 The Aggregate Demand (AD) curve An increase in the price level causes the level of aggregate output (income) to fall. A decrease in the price level causes the level of aggregate output (income) to rise. Each pair of values of P and Y on the aggregate demand curve corresponds to a point at which both the goods market and the money market are in equilibrium.
THE AGGREGATE DEMAND CURVE THE AGGREGATE DEMAND CURVE: A WARNING Aggregate demand falls when the price level increases because the higher price level causes the demand for money (Md) to rise. With the money supply constant, the interest rate will rise to reestablish equilibrium in the money market. It is the higher interest rate that causes aggregate output to fall. The AD curve is not the sum of all the market demand curves in the economy. It is not a market demand curve.
THE AGGREGATE DEMAND CURVE OTHER REASONS FOR A DOWNWARD-SLOPING AGGREGATE DEMAND CURVE The Consumption Link Planned investment does not bear all the burden of providing the link from a higher interest rate to a lower level of aggregate output. Decreased consumption brought about by a higher interest rate also contributes to this effect. The Real Wealth Effect real wealth, or real balance, effect The change in consumption brought about by a change in real wealth that results from a change in the price level. An increase in the price level lowers the real value of some types of wealth.
THE AGGREGATE DEMAND CURVE equilibrium condition: C + I + G = Y AGGREGATE EXPENDITURE AND AGGREGATE DEMAND At every point along the aggregate demand curve, the aggregate quantity demanded is exactly equal to planned aggregate expenditure, C + I + G.
THE AGGREGATE DEMAND CURVE SHIFTS OF THE AGGREGATE DEMAND An increase in the quantity of money supplied at a given price level shifts the aggregate demand curve to the right. An increase in government purchases or a decrease in net taxes shifts the aggregate demand curve to the right. FIGURE 13.3 The Impact of an Increase in the Money Supply on the AD Curve FIGURE 13.4 The Effect of an Increase in Government Purchases or a Decrease in Net Taxes on the AD Curve
THE AGGREGATE DEMAND CURVE SHIFTS OF THE AGGREGATE DEMAND FIGURE 13.5 Factors That Shift the Aggregate Demand Curve
THE AGGREGATE SUPPLY CURVE aggregate supply The total supply of all goods and services in an economy. THE AGGREGATE SUPPLY CURVE: A WARNING aggregate supply (AS) curve A graph that shows the relationship between the aggregate quantity of output supplied by all firms in an economy and the overall price level. An “aggregate supply curve” in the traditional sense of the word supply does not exist. What does exist is what we might call a “price/output response” curve—a curve that traces out the price decisions and output decisions of all the markets and firms in the economy under a given set of circumstances.
THE AGGREGATE SUPPLY CURVE AGGREGATE SUPPLY IN THE SHORT RUN Capacity Constraints Even if firms are not holding excess labor and capital, the economy may be operating below its capacity if there is cyclical unemployment. Output Levels and Price/Output Responses An increase in aggregate demand when the economy is operating at low levels of output is likely to result in an increase in output with little or no increase in the overall price level. That is, the aggregate supply (price/output response) curve is likely to be fairly flat at low levels of aggregate output. FIGURE 13.6 The Short-Run Aggregate Supply Curve When the economy is producing at its maximum level of output—that is, at capacity— the aggregate supply curve becomes vertical.
THE AGGREGATE SUPPLY CURVE AGGREGATE SUPPLY IN THE SHORT RUN The Response of Input Prices to Changes in the Overall Price Level If input prices changed at exactly the same rate as output prices, the AS curve would be vertical. Wage rates may increase at exactly the same rate as the overall price level if the price level increase is fully anticipated. Input prices—particularly wage rates—tend to lag behind increases in output prices for a variety of reasons.
THE AGGREGATE SUPPLY CURVE SHIFTS OF THE AGGREGATE SUPPLY CURVE cost shock, or supply shock A change in costs that shifts the aggregate supply (AS) curve. FIGURE 13.7 Shifts of the Aggregate Supply Curve
THE AGGREGATE SUPPLY CURVE SHIFTS OF THE AGGREGATE SUPPLY CURVE FIGURE 13.8 Factors That Shift the Aggregate Supply Curve
THE EQUILIBRIUM PRICE LEVEL equilibrium price level The price level at which the aggregate demand and aggregate supply curves intersect. FIGURE 13.9 The Equilibrium Price Level
THE LONG-RUN AGGREGATE SUPPLY CURVE If wage rates and other costs fully adjust to changes in prices in the long run, then the long-run AS curve is vertical. POTENTIAL GDP potential output, or potential GDP The level of aggregate output that can be sustained in the long run without inflation. FIGURE 13.9 The Long-Run Aggregate Supply Curve
AGGREGATE DEMAND, AGGREGATE SUPPLY,AND MONETARY AND FISCAL POLICY FIGURE 13.11 A Shift of the Aggregate Demand Curve When the Economy Is on the Nearly Flat Part of the AS Curve FIGURE 13.12 A Shift of the Aggregate Demand Curve When the Economy Is Operating at or Near Maximum Capacity LONG-RUN AGGREGATE SUPPLY AND POLICY EFFECTS If the AS curve is vertical in the long run, neither monetary policy nor fiscal policy has any effect on aggregate output in the long run.
CAUSES OF INFLATION INFLATION VERSUS SUSTAINED INFLATION: A REMINDER inflation An increase in the overall price level. sustained inflation Occurs when the overall price level continues to rise over some fairly long period of time. DEMAND PULL INFLATION demand-pull inflation Inflation that is initiated by an increase in aggregate demand.
CAUSES OF INFLATION COST-PUSH, OR SUPPLY-SIDE, INFLATION cost-push, or supply-side, inflation Inflation caused by an increase in costs. FIGURE 13.13 Cost-Push, or Supply-Side, Inflation stagflation Occurs when output is falling at the same time that prices are rising.
CAUSES OF INFLATION EXPECTATIONS AND INFLATION FIGURE 13.14 Cost Shocks Are Bad News for Policy Makers
CAUSES OF INFLATION MONEY AND INFLATION hyperinflation A period of very rapid increases in the price level FIGURE 13.15 Sustained Inflation from an Initial Increase in G and Fed Accommodation
REVIEW TERMS AND CONCEPTS • aggregate demandaggregate demand (AD) • curveaggregate supply • aggregate supply (AS) • curve • cost-push, or supply-side, inflation • cost shock, or supply shock • demand-pull inflation equilibrium price levelhyperinflationinflation inflationary gap potential output, or potential GDP real wealth, or real balance, effect stagflation sustained inflation