Download
1 / 4

E N D
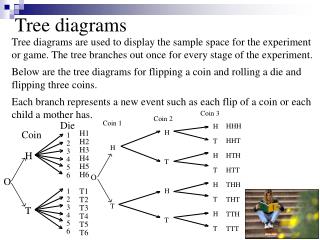
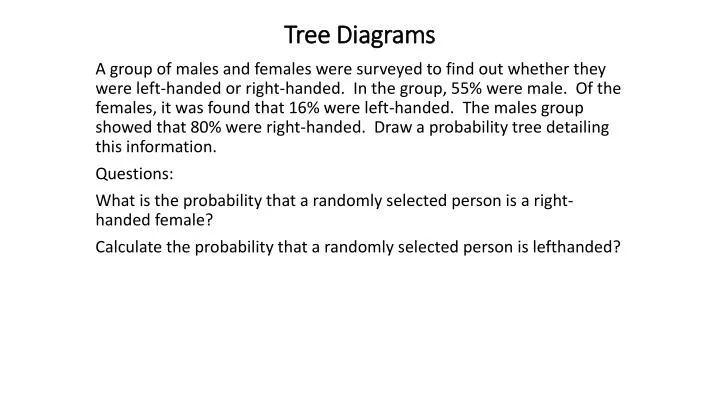
Tree Diagrams A group of males and females were surveyed to find out whether they were left-handed or right-handed. In the group, 55% were male. Of the females, it was found that 16% were left-handed. The males group showed that 80% were right-handed. Draw a probability tree detailing this information. Questions: What is the probability that a randomly selected person is a right-handed female? Calculate the probability that a randomly selected person is lefthanded?
0.8 0.44 = 0.550.8 Right-handed Male • What is the probability that a randomly selected person is a right-handed female? • Calculate the probability that a randomly selected person is lefthanded? 0.11 + 0.072 0.55 0.2 0.11 = 0.550.2 Left-handed Sex Right-handed 0.84 0.378 = 0.450.84 0.45 Female Left-handed 0.16 0.072 = 0.450.16
Problem Elaine is enrolled in a self-paced course that allows three attempts to pass an exam on the material. She does not study and has probability 0.2 of passing on the first try. If she fails on the first try, her probability of passing on the second try increases to 0.3 because she learned something on the first attempt. If she fails on two attempts, the probability of passing on a third attempt is 0.4. She will stop as soon as she passes. The course rules force her to stop after three attempts in any case. Draw a tree diagram to illustrate what is described above, and use it to determine the probability that Elaine passes the exam.
Elaine is enrolled in a self-paced course that allows three attempts to pass an exam on the material. She does not study and has probability 0.2 of passing on the first try. If she fails on the first try, her probability of passing on the second try increases to 0.3 because she learned something on the first attempt. If she fails on two attempts, the probability of passing on a third attempt is 0.4. She will stop as soon as she passes. The course rules force her to stop after three attempts in any case. Problem 2 Solution P(passing) = 0.2 + 0.8 0.3 + 0.8 0.7 0.4 = 0.2 + 0.24 + 0.224 = 0.664