Download
1 / 27
270 likes | 340 Views
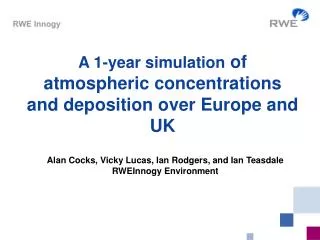
Trends of POP concentrations in air and deposition in the northern Europe. Eva Brorström-Lundén, Katarina Strömberg Erika Junedahl and Anna Palm Swedish Environmental Research Institute, IVL Sirkka Leppanen, Finnish Meteorological Institute, FMI.

E N D
Trends of POP concentrations in air and deposition in the northern Europe • Eva Brorström-Lundén, Katarina Strömberg • Erika Junedahl and Anna Palm • Swedish Environmental Research Institute, IVL • Sirkka Leppanen, • Finnish Meteorological Institute, FMI
Atmospheric Concentrations and Deposition Fluxes of POPs in Scandinavia • Seasonal variations • Spatial variations • Time trends
Measurements of POPs Research program 1989-1994 Measurements of POPs have been carried at coastal and sea based stations at the Swedish west coast Monitoring program 1994- Measurements of POPs were included in the Swedish monitoring program for air pollutants - One station at the Swedish west coast, Rörvik Included in the EUROTRAC subproject MEPOP
Measurements of POPs Monitoring program 1996- One additional station located in the northern of Finland was included in the Swedish monitoring program, Pallas These measurements are carried out as a Swedish (IVL)and Finnish (FMI) co-operation.
Measurement program Measurements of POPs in air and deposition are carried out simultaneously at the two sites with a frequency of one week per month.
Measurement technique air High volume air sampler (HVS) PUF plugs for collecting POPs i the gas phase and a glas fiber filter for particle bound POPs
Measurement technique deposition Bulk sampler 1 m2 Teflon coated surface with 10 cm edges and a PUF cassette in the centre. A modified sampler are used for snow collection at Pallas. The deposition samples include both precipitation and deposited particles.
POPs in the program Polycyclic aromatic hydrocarbons (11 PAHs) Polychlorinated biphenyls, PCBs (IUPAC no:s 28, 52,101, 18,153, 138, 180) Hexachlorocyclohexanes (alpha- and gamma HCH) POPs which differ in chemical and physical properties and with different exposure pattern
The atmospheric concentrations of PAHs at Rörvik 1989-2000: Time trends and seasonal variation
The yearly average concentrations of PAHs in air at Rörvik 1994-2000 Data from April 1995 has been excluded
The atmospheric concentrations of B(a)P at Rörvik and Pallas: Spatial and seasonal variations during 1996-2000
The atmospheric concentrations of PCBs at Rörvik 1989-2000: Time trends and seasonal variation
Time trends in air The yearly average concentrations of PCB 28 and PCB 153 Rörvik 1995-2000
The atmospheric concentrations of PCBs at Rörvik and Pallas: Spatial and seasonal variations during 1996-2000
The atmospheric concentrations of HCHs at the Swedish west coast Rörvik 1989-1999
The yearly average concentrations of HCHs at Rörvik 1994 -1999
The atmospheric concentrations of HCHs at the Swedish west coast and in the northern Finland: Spatial and seasonal variations during 1996-1999
POPs in the atmosphere • Conclusions • A seasonal variation are observed: • The PAH levels are highest in the winter • The PCB and HCH levels are highest during the summer • The atmospheric concentrations of PCBs and HCHs at the Swedish west coast have decreased between 1989-2000 • The PAH levels are higher in the south compared to the north while the levels of PCBs and HCHs in Pallas and Rörvik are similar. Evidence for long-range transport
Deposition Fluxes of POPs at the Swedish west coast Summary The greatest amounts of the measured POPs are deposited in connection to long-range air transport and/or together with heavy precipitation The measured deposition fluxes of PAHs and PCBs are mostly due to particle deposition in connection with precipitation while HCHs are washed out with the precipitation
Deposition Fluxes of PCBs in relation to the concentrations in air at the Swedish west coast Data from Rörvik 1995-1998
The average distribution among PAHs and PCBs at Rörvik 1995 -1999
Estimated yearly deposition of PAHs (sum) and at Rörvik and Pallas 1995-1999 ug/m2 year
Estimated yearly deposition of PCBs (sum 7) at Rörvik and Pallas 1995-1999 ng/m2year
Monitoring program from 2001 • The sampling program at the Swedish west coast of POPs includes: • Air Weekly sampling • Deposition Monthly sampling • These measurements of POPs are included in the Swedish monitoring program for air pollutants and financed by The Swedish Environmental Protection Agency
POPs included in program from 2001 • PAHs • PCBs • HCHs • Chlordanes DDTs • HCB • New • Brominated flame retardants PBDE