Download
1 / 59
590 likes | 742 Views
Beyond Estimation TM The Cost Reconciliation Tracker TM Construction Cost Forecast James Vermeulen, PQS, LEED AP – Co CEO Blair Tennant, LEED AP – Project Manager. Toronto Boston Dallas Los Angeles. www.vermeulens.com.

E N D
Beyond Estimation TM The Cost Reconciliation Tracker TM Construction Cost Forecast James Vermeulen, PQS, LEED AP – Co CEO Blair Tennant, LEED AP – Project Manager Toronto Boston Dallas Los Angeles • www.vermeulens.com
Vermeulens is a Registered Provider with The American Institute of Architects Continuing Education Systems. Credit earned on completion of this program will be reported to CES Records for AIA members. Certificates of Completion for non-AIA members are available on request.This program is registered with the AIA/CES for continuing professional education. As such, it does not include content that may be deemed or construed to be an approval or endorsement by the AIA of any material of construction or any method or manner of handling, using, distributing, or dealing in any material or product. Questions related to specific materials, methods, and services will be addressed at the conclusion of this presentation. 2
LEARNING OBJECTIVES Cost Reconciliation Tracker Present trends in median trade costs from January 2008 - Current Quantify current cost reductions and provide future cost projections. Construction Cost Inflation Understand historic trends in construction cost inflation Where we were. Where we are. Where we are going. Cost Drivers Examine the cost impact of: Volume, Commodities, Labor & Profit Margin Economic Drivers Examine the cost impact of: Commodity Pricing, Equity Markets, Exchange Rates & Employment 3
High/Low -4.1% Low / Current +3.7% Growth Rates Q3 09 +1.6% Q4 09 +4.9% Q1 10 +3.7% Q2 10 +1.7% Q3 10 +2.5%
STRUCTURAL STEEL ($/TON) +9% -1% -13% -9% -11% $2,940 - $3,300 $3,260- $3,565 $2,785- $3,140 $2,410- $2,855 $2,385- $2,723 $2,285- $2,530 $3,410 Average $3,120 Average $2,965 Average $2,610Average $2,635 Average $2,408Average $180 Deviation $150 Deviation -29%
CONCRETE SLAB ON DECK ($/SF) +2% -14% -8% $5.1 - $6.1 $5.1 - $6.3 $4.6 - $5.3 $4.3 - $4.8 $4.3 - $4.9 $4.5 - $5.3 +3% +5% -21%
MASONRY - CMU ($/SF) +20% -2% -6% -3% -8% $16.0 - $17.9 $15.6 - $17.7 $14.7 - $16.7 $14.8 - $15.6 $12.8- $14.9 $15.8- $17.7 -18%
ROOFING MEMBRANE ($/SF) +8% +2% -11% -2% $13.2 - $15.1 $13.2 - $16.5 $14.0 - $17.0 $14.8 - $16.9 $13.4 - $14.8 $12.7 - $15.0 -13%
CURTAINWALL ($/SF) +4% +12% -15% -3% -8% $95- $114 $99- $118 $84- $101 $84- $96 $76- $88 $86- $96 -24%
DRYWALL PARTITIONS ($/SF) -1% -9% -9% -7% +10% $7.1 - $8.2 $7.1- $7.9 $6.4- $7.4 $5.7- $6.8 $6.5- $7.2 $6.1- $6.8 -18%
ELEVATORS ($/STOP) $58,000 - $70,000 $31,500 - $37,000
PLUMBING – BRANCH PIPE ($/LF) +4% -4% -5% -7% +4% $26- $29 $28 - $30 $26 - $29 $25 - $27 $24 - $25 $24 - $26 -16%
DUCTWORK ($/LBS) +3% +1% -8% -4% -1% $7.8 - $8.5 $7.0 - $7.9 $6.8 - $7.5 $7.1- $7.4 $7.0- $7.4 $7.4 - $8.4 -12%
CONTROLS ($/PT) +3% -12% -1% -1% -5% $1,110 - $1,220 $1,130 - $1,270 $1,000 - $1,110 $1,000 - $1,090 $970 - $1,050 $951 - $1,040 -17%
ELECTRICAL FEEDER ($/LF) +6% +4% -21% -3% -6% $114 - $139 $127 - $141 $97 - $114 $93 - $112 $100 - $114 $96 - $105 -25%
GENERAL REQUIREMENTS \ CONDITIONS +4% +12% -3% -6% -1% 7.7% - 11.5% 7.4% - 11.2% 8.3% - 10.9% 8.3% - 9.7% 8.2% - 9.6% 8.4% - 11.3% -10%
GENERAL REQUIREMENTS \ CONDITIONS 1.5% 1.4% 1.3% 1.3% 1.1% 1.0% 0.6%
CONTRACTOR’S FEE (%DIRECTS) +2% -15% -6% -3% -4% 2.8% - 3.4% 2.8% - 3.5% 2.6% - 3.3% 2.6% - 3.1% 2.4% - 3.1% 2.0% - 2.7% -25%
COST RECONCILIATION TRACKER SUMMARY
TRADE SUMMARY Trade 2008 Peak – Bottom 2010 Concrete -21% Masonry -18% Steel -29% Roofing -13% Curtainwall -24% Drywall -18% Plumbing -16% Ductwork -12% Controls -17% Feeder -25% GC’s & GR’s -10% Contractor’s Fee -25%
CONSTRUCTION COST IMPACT Typical Institutional Project – Direct Trade Cost Peak 2008 – Bottom 2010 -14% Assumes trade-weighted average of individual percentage trade reduction
WHITING-TURNER CONTRACTING Peak 2008 – Q3 2010 -13.2%
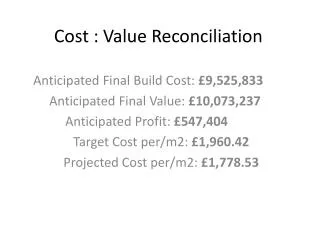
BUDGET EXAMPLE Q2 2010 - $114M 14% Escalation -25% Q3 2008 - $100M 14% Market Adj -28% Q2 2010 - $86M -5% 5% Bids @ Cost Q2 2010 - $82M
WHEN WILL THE WINDOW CLOSE ?
COST DRIVERS Volume Commodity Pricing Labor Productivity Profit Margins
STRUCTURAL STEEL PRICING • Markup • Overhead, Equipment, • Profit: (Manufacturer & Contractor) • Material • Raw Goods
US DOLLAR RISK HEDGE High/Low -26% Low / Mar 09 +18% Mar09/Current -11%
US DOLLAR RISK HEDGE Low / High +123% High / Mar 09 -58% Mar09/Current +91%
US DOLLAR IMPACT ON COMMODITIES Low/High +164% High/ Mar 09 -56% Mar09/Current +57%
CONSTRUCTION EMPLOYMENT High/Low Total – 6% Construction – 28% Low/Current Total + 1% Construction +0.3%
CONSTRUCTION VOLUME High/Low Total –35% Infra –11% Res –66% Non Res –37% Low/Current Total +2% Infra +11% Res +6% Non Res +0.5% $140B Stimulus Package
CONSTRUCTION COST INDEX Trendline Avg W-T 3.5% ENR 3.0% Gov 2.6% % Decline (Peak – Current) W-T -11.6% Gov -4.9% ENR +2.5%