Download
1 / 5
50 likes | 172 Views
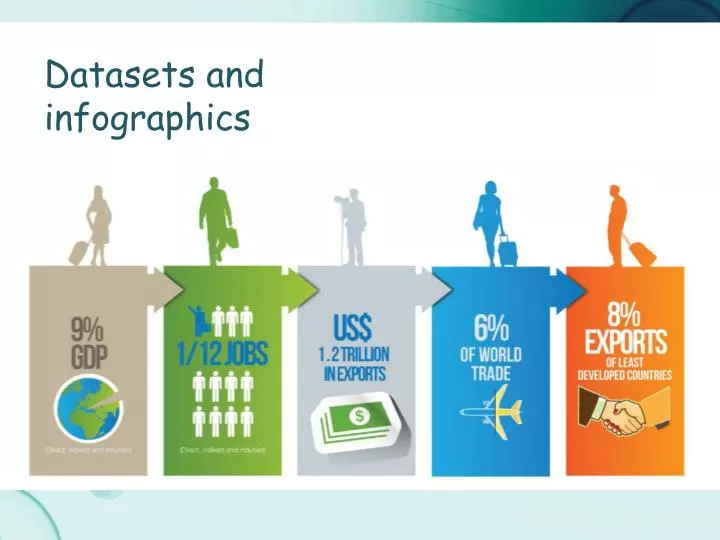
Datasets and infographics. Objectives. Can I explain what an info-graphic is and why we use them? Can I use a dataset to create my own info-graphic?. To start. As a group look at this: http :// htwins.net/scale2/ this is an example of a very advanced info-graphic. To start.

E N D
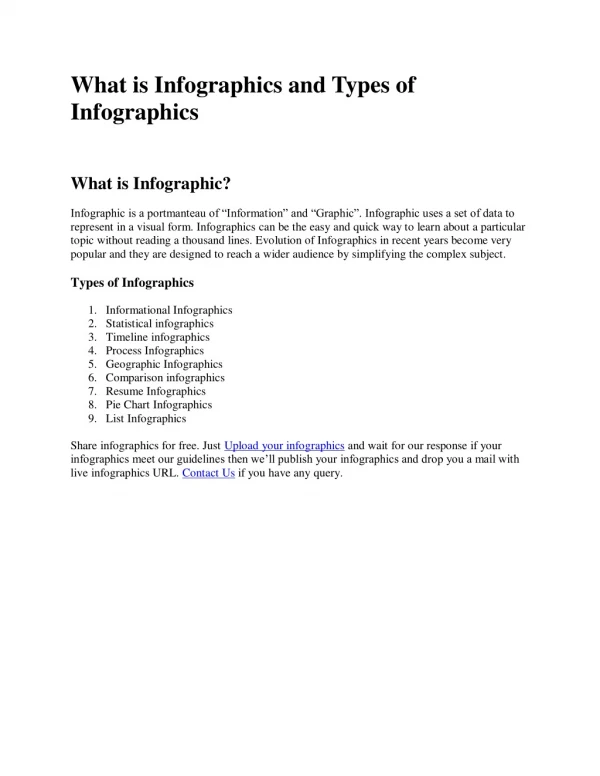
Objectives • Can I explain what an info-graphic is and why we use them? • Can I use a dataset to create my own info-graphic?
To start • As a group look at this: http://htwins.net/scale2/ • this is an example of a very advanced info-graphic
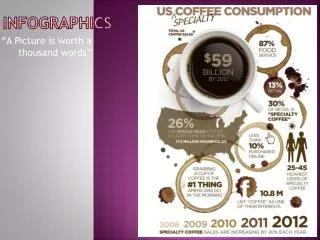
To start • Here are 2 examples of static info-graphics: http://farm3.static.flickr.com/2541/4187586892_c57cc0f100.jpg http://www.webhostingmasters.com/wp-content/uploads/2012/04/social_media_infographic-02.jpg • Now use the web to find your own examples of info-graphics
Success Criteria All: will have created a basic info-graphic in Excel and will have pasted it into a Word document Most: will have annotated and improved their infographicin Word to make it more visually appealing • Add images • Add labels • Explain what it shows Some: will use advanced chart formatting features in Excel • Will have created more than one chart