Download

1 / 23
230 likes | 439 Views
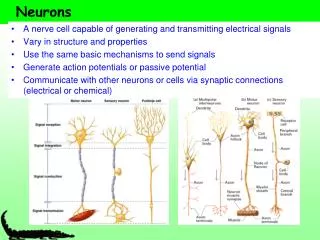
Neurons. 4/15/09. Fig. 48-4. Dendrites. Stimulus. Presynaptic cell. Nucleus. Axon hillock. Cell body. Axon. Synapse. Synaptic terminals. Postsynaptic cell. Neurotransmitter. Fig. 48-5. Dendrites. Axon. Cell body. Portion of axon. 80 µm. Cell bodies of overlapping neurons.

E N D
Neurons 4/15/09
Fig. 48-4 Dendrites Stimulus Presynaptic cell Nucleus Axon hillock Cell body Axon Synapse Synaptic terminals Postsynaptic cell Neurotransmitter
Fig. 48-5 Dendrites Axon Cell body Portion of axon 80 µm Cell bodies of overlapping neurons Sensory neuron Interneurons Motor neuron
Fig. 48-6a OUTSIDE CELL [Na+] 150 mM [Cl–] 120 mM [K+] 5 mM [A–] 100 mM [K+] 140 mM INSIDE CELL [Na+] 15 mM [Cl–] 10 mM (a)
Fig. 48-6b Key Sodium- potassium pump Na+ Potassium channel Sodium channel K+ OUTSIDE CELL INSIDE CELL (b)
Fig. 48-7 –90 mV +62 mV Inner chamber Outer chamber 150 mM 140 mM 15 mM 5 mM KCI NaCI KCI NaCI Cl– K+ Na+ Cl– Sodium channel Potassium channel (b) Membrane selectively permeable to Na+ (a) Membrane selectively permeable to K+ ( ( ) ) 5 mM 150 mM ENa = 62 mV log log = –90 mV = +62 mV EK = 62 mV 140 mM 15 mM
Fig. 48-9a Stimuli +50 0 Membrane potential (mV) –50 Threshold Resting potential Hyperpolarizations –100 1 5 2 3 4 0 Time (msec) (a) Graded hyperpolarizations
Fig. 48-9b Stimuli +50 0 Membrane potential (mV) Threshold –50 Resting potential Depolarizations –100 0 1 5 2 3 4 Time (msec) (b) Graded depolarizations
Fig. 48-9c Strong depolarizing stimulus +50 Action potential 0 Membrane potential (mV) –50 Threshold Resting potential –100 0 2 4 5 6 1 3 Time (msec) (c) Action potential
Fig. 48-10-1 Key Na+ K+ +50 Action potential 3 0 Membrane potential (mV) 2 4 Threshold –50 1 1 5 Resting potential Depolarization –100 Time Extracellular fluid Sodium channel Potassium channel Plasma membrane Cytosol Inactivation loop Resting state 1
Fig. 48-10-2 Key Na+ K+ +50 Action potential 3 0 Membrane potential (mV) 2 4 Threshold –50 1 1 5 Resting potential Depolarization 2 –100 Time Extracellular fluid Sodium channel Potassium channel Plasma membrane Cytosol Inactivation loop Resting state 1
Fig. 48-10-3 Key Na+ K+ Rising phase of the action potential 3 +50 Action potential 3 0 Membrane potential (mV) 2 4 Threshold –50 1 1 5 Resting potential Depolarization 2 –100 Time Extracellular fluid Sodium channel Potassium channel Plasma membrane Cytosol Inactivation loop Resting state 1
Fig. 48-10-4 Key Na+ K+ Falling phase of the action potential 4 Rising phase of the action potential 3 +50 Action potential 3 0 Membrane potential (mV) 2 4 Threshold –50 1 1 5 Resting potential Depolarization 2 –100 Time Extracellular fluid Sodium channel Potassium channel Plasma membrane Cytosol Inactivation loop Resting state 1
Fig. 48-10-5 Key Na+ K+ Falling phase of the action potential 4 Rising phase of the action potential 3 +50 Action potential 3 0 Membrane potential (mV) 2 4 Threshold –50 1 1 5 Resting potential Depolarization 2 –100 Time Extracellular fluid Sodium channel Potassium channel Plasma membrane Cytosol Inactivation loop Undershoot 5 Resting state 1
Fig. 48-11-1 Axon Plasma membrane Action potential Cytosol Na+
Fig. 48-11-2 Axon Plasma membrane Action potential Cytosol Na+ Action potential K+ Na+ K+
Fig. 48-11-3 Axon Plasma membrane Action potential Cytosol Na+ Action potential K+ Na+ K+ Action potential K+ Na+ K+
Fig. 48-12 Node of Ranvier Layers of myelin Axon Schwann cell Schwann cell Nucleus of Schwann cell Nodes of Ranvier Axon Myelin sheath 0.1 µm
Fig. 48-13 Schwann cell Depolarized region (node of Ranvier) Cell body Myelin sheath Axon
Fig. 48-14 Postsynaptic neuron Synaptic terminals of pre- synaptic neurons 5 µm
Fig. 48-16 Terminal branch of presynaptic neuron E1 E1 E1 E1 E2 E2 E2 E2 Axon hillock Postsynaptic neuron I I I I 0 Action potential Action potential Threshold of axon of postsynaptic neuron Membrane potential (mV) Resting potential –70 E1 + I I E1 E1 E1 E1 E1 E1 + E2 (b) Temporal summation (d) Spatial summation of EPSP and IPSP (a) Subthreshold, no summation (c) Spatial summation