Download
1 / 36
360 likes | 449 Views
Predictors of Low Birth Weight And Geographic Access to Prenatal Care in Kansas, 1999. National Association for Public Health Statistics and Information Systems Annual Meeting June 7, 2006 San Diego, CA V. James Guillory, DO, MPH, FACPM Glynda Sharp, MHA Greg Crawford, BS.

E N D
Predictors of Low Birth WeightAnd Geographic Access to Prenatal Care in Kansas, 1999 National Association for Public Health Statistics and Information Systems Annual Meeting June 7, 2006 San Diego, CA V. James Guillory, DO, MPH, FACPM Glynda Sharp, MHA Greg Crawford, BS
Practical Applications of Research on MCH at State Level • Identifies specific areas and sources of concernwhere birth outcomes and maternal health can be improved • Provides important information so that resources can best be allocated to achieve the greatest improvement • Informs policymakers • Drives policy formation.
Traditional Predictors of Infant Mortality in the United States • Low birth weight (<2500 grams)* • Preterm births (<37 weeks gestation) • Prenatal care • Early vs late initiation • Adequacy • *ACCESS to Prenatal care • Maternal factors • health/morbidities (anemia, DM, HTN) • behavioral (tobacco, ETOH, drugs, nutrition) • demographic (race, teen birth rate, education, marital status) *The US ranks last of 13 developed nations in LBW
What We Know: Barriers to Adequate Prenatal Care • Mothers in rural areas: • Lack available local prenatal and obstetrical care • Less access to health insurance • less prenatal care visits • start prenatal care later • Increased morbidity • Greater distance and travel time to providers • Transportation problems • Child-care difficulties for larger families
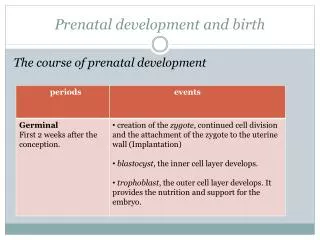
Importance of LBW The rates of low birth weight are relatively unchanged over the past 35 years LBW is a major predictor of infant morbidity and mortality
National Objectives Related to Infant Health • Healthy People 2010 • Reduce infant morbidity and mortality • Decrease disparities in health
Comparison of Kansas Birth Outcomes to the United States and HP2010 Objectives, 1999 % Kansas % U.S. % HP 2010 Target % Kansas % U.S. % HP 2010 Target Low birth weight (<2500 grams) 6.99 7.6 5 Very low birth weight (<1500 grams) 1.24 1.5 0.9 14 Total Preterm (<37 weeks)** 8.38 11.8 7.6 Live births 32-36 weeks 7.05 * 6.4 Live births <32 weeks 1.33 1.96 1.1 11.8 12 10 8.38 7.6 7.6 8 6.99 7.05 6.4 6 5 4 1.5 1.96 1.33 2 1.24 1.1 0.9 0 0 Low birth weight (<2500 g) Very low birth weight (<1500g) Preterm (<37 weeks)** Live births 32-36 weeks Live births <32 weeks * n = 38,194 (> 350 grams and > 20 weeks gestation) **Rate has risen steadily during the 1990's by about 11 percent
How Kansas Compares to the Nation: LBW 2002 Kansas: 46 out of 51 (51 is Best) Best: Alaska, 5.8%; Worst: D.C., 11.6% Mississippi, 11.2%
Research Objectives • Assess the quality of birth certificate data for use in multivariate statistical analysis • Assess relationship between factors and LBW • Maternal characteristics • Prenatal care • Insurance status • Geographic location • Determine the predictors of low birth weight using regression analysis
Methods • Kansas Birth Certificate data linked to Medicaid Claims data, 1999 • Data file prepared by the Office of Vital Statistics, Kansas Department of Health and Environment • Obtained IRB approval
Methods continued . . . • Inclusion criteria • Single live births • Birthweight > 350 grams • Gestation > 20 weeks • Exclusion Criteria • Missing data for dependent or independent variables of concern
Methods (continued) • Primary outcomes • Proportion of infants with low birth weight • Predictors of importance • Geographic distribution • Insurance status • Other maternal characteristics
Geographic Distributionbased on 2000 Census Bureau County Designations • Based on commuting patterns and their resulting economic resource flow • 3 Designations • Metropolitan • Micropolitan • Non-metropolitan Ratcliff MR. Creating Metropolitan and Micropolitan Statistical Areas. Office of Management and Budget. 1998. Alternative Approaches to Defining Metropolitan and Non-metropolitan Areas. Federal Register, 63:244:70526-70561
Statistical Methodology • Univariate analysis • Chi square for tests of significance of categorical variables • Student’s t-test for analysis of continuous variables • Statistical significance at alpha < 0.05 • Multiple regression analysis • Logistic regression • Stepwise • Only those variables with a p-value < 0.0001 were entered into the model
Kansas Births, 1999* • 38,748 births Number % • Single Births 37,605 97.1 • Twin Births 1,090 2.8 • Triplet Births 53 0.1 • Race • White 34,483 89.2 • Black/African American 2,841 7.4 • Native American 365 0.9 • Asian/HI/PI/Other 972 2.5 • Gender • Male 20,096 51.9 • Female 18,652 48.1 *All births
Association Between Maternal Demographic Characteristics and Low Birth Weight: Single Births (n=37081) Infants with Low Birth Weight (< 2500 grams) Maternal Race n% White 1667 5.04* African American 296 10.81 Native American 16 4.57 Asian/HI/PI/Other 56 6.03 Maternal Marital Status Married 1207 4.57* Not Married 828 7.79 Maternal Education <HS Grad 538 7.75* HS Grad 701 6.34 Any College 796 4.17 Maternal Age <20 years old 366 7.65* 20+ years old 1669 5.17 *p<0.0001
Association Between Prenatal Care, Medicaid and Low Birth Weight: Single Births Infants withLow Birth Weight (< 2500 grams) Trimester PN Care Begann% 1st Trimester 1673 5.26* None or Later 362 6.86 Maternal Medicaid Status No Medicaid 1243 4.59* Moms with Medicaid 792 7.92 *p<0.0001
Association Between Maternal Behavior and LBW Alcohol Use Chi square = 33.4 p = <0.0001 Smoker Chi square = 196.6 p = <0.0001 Obesity >20% Chi square = 16.9 p = <0.0001 Under weight mother Chi square = 15.2 p = <0.0001
Association between Maternal Medical Factors Associated with Pregnancy and Infant Low Birth Weight % Low Birth Weight < 2500 grams % Low Birth Weight Uterine Bleeding Yes 11.72 Uterine Bleeding No 5.43 60 (< 2500 grams) Hydramnios/Oligo Hydramnios Yes 18.9 Hydramnios/Oligo Hydramnios No 5.36 Eclampsia Yes 50 50 Eclampsia No 5.47 50 Pre-clampsia Yes 17.46 Pre-clampsia No 5.05 40 30 17.46 18.9 20 11.72 10 5.47 5.43 5.05 5.36 0 Yes No Yes No Yes No Yes No Hydramnios / Oligo Pre-clampsia Eclampsia Uterine Bleeding Hydramnios 2 Chi = 61.1432 2 Chi = 379.1178 2 Chi = 27.723 p = <.0001 p = <.0001 2 p = <.0001 Chi = 120.3296 p = <.0001
Association between Maternal Medical Factors Not Associated with Pregnancy and Infant Low Birthweight % Low Birth Weight < % Low Birth Weight 2500 grams 28.57 Other STD Yes 8.07 30 Other STD No 5.44 (< 2500 grams) Hemoglobinopathy Yes 28.57 Hemoglobinopathy No 5.48 Cardiac Disease Yes 12.1 25 Cardiac Disease No 5.47 Chronic Hypertension Yes 17.32 Chronic Hypertension No 5.41 Lung Disease Yes 8.26 Lung Disease No 5.46 20 17.32 15 12.1 10 8.26 8.07 6.46 5.48 5.44 5.41 5.47 5 0 Yes No Yes No Yes No Yes No Yes No Other STD Lung Disease Cardiac Disease Chronic Hypertension Hemoglobinopathy Chi = 8.7675 Chi = 7.1922 2 2 2 2 2 Chi = 569.0593 Chi = 5.2569 Chi = 10.4759 p = 0.0031 p = 0.0073 p = <.0001 p = 0.0219 p = 0.0012
Association Between Medicaid and Conditions Not Associated With Pregnancy Medicaid Non-Medicaid p-value %% Hepatitis, B/HBsAg 0.14 0.06 0.02 Genital Herpes 1.21 0.9 0.01 AIDS or HIV 0.03 0.01 0.1 Other STD 4.13 0.95 <.0001 Anemia (HCT <30) 2.51 1.33 <.0001 Hemoglobinopathy 0.04 0.01 0.07 Cardiac Disease 0.35 0.33 0.75 Diabetes 2.32 1.92 0.02 Hypertension, Chronic 0.64 0.7 0.52 Lung Disease 1.34 0.8 <.0001 Renal Disease 0.39 0.26 0.04
Behavioral Factors and Medicaid Medicaid Non-Medicaid %%p-value Underwieght <10% 0.65 0.27 <.0001 Obesity >20% 9.56 6.41 <.0001 Smoker 25.54 7.85 <.0001 Alcohol Use 1.13 0.45 <.0001
Maternal Comorbidity and Comorbidity Associated with Pregnancy: Comparison Between Medicaid and Non-Medicaid Medicaid Non-Medicaid p-value Any Comorbidity 56.49 40.76 <.0001 Uterine Bleeding 1.27 0.89 <.0001 Incompetent Cervix 0.02 0.01 0.51 Isoimmunization 0.05 0.08 0.32 Hydramnios/Oligohydramnios 1.13 0.85 0.01 Eclampsia 0.06 0.04 0.34 Pre-Eclampsia 3.95 3.43 0.02
1999 Kansas BirthsBy Geographic Location • Metropolitan 23,460 63.3% • Micropolitan 8,735 23.6% • Non-metropolitan 4,885 13.2%
Multiple Regression Analysis • Covariates were assessed to determine the independent contribution to LBW deliveries in Kansas while adjusting for all known variables that were very highly statistically associated (p< 0.001) with LBW (adjusted p-value because of multiplicity)
Adjusted Odds Ratio Estimates—LBW* Point Predictor Estimate 95% CI p-value PRETERM 41.756 37.386 46.638 <.0001 NONWHITE 1.888 1.585 2.248 <.0001 EDUCATION 0.868 0.757 0.996 0.0431 PRIORBABY 1.238 1.097 1.399 0.0006 UNMARRIED 1.243 1.089 1.419 0.0012 UT. BLEEDING 1.802 1.196 2.714 0.0049 HYDRAMNIOS 2.790 1.906 4.083 <.0001 ECLAMPSIA 11.868 2.976 47.338 0.0005 PRE-ECLAMPSIA 2.223 1.812 2.726 <.0001 PREV. SGA/PT 2.143 1.640 2.799 <.0001 CHRONIC HTN 2.561 1.628 4.029 <.0001 OBESITY >20% 0.505 0.395 0.645 <.0001 SMOKING 2.178 1.886 2.514 <.0001 MEDICAID 1.205 1.056 1.3750.0056 *Prenatal care drops out of the model
Conclusions • Rate of preterm and low birth weight infants in Kansas and disparities in these outcomes was similar to the nation • Women who did not have private insurance were less healthy and had worse birth outcomes • Women with Medicaid had a 20% increase in the likelihood of having a LBW infant when adjusting for other factors.
Conclusions • Geographic Location Does Matter • Women in micropolitan counties • Started prenatal care later • based on average month of starting care • Had fewer prenatal visits • Were less likely to have private insurance • Had multiple indicators that increase potential for • worse birth outcomes • less access to health care • Poorer health
Conclusions • Insurance matters • Late or no prenatal care greatest for women without private insurance • Birth outcomes worse for infants born to mothers on Medicaid • Need to separate public insurance from no insurance • Results suggest that birth outcomes may be improved through increased focus on maternal health rather than prenatal care
Conclusions (continued ) • “Poor access indicators most often suggest the need to make health care more affordable.” (Pathman DE, Ricketts III TC, Konrad Thomas. How Adults’ Access to Outpatient Physician Services Relates to the Local Supply of Primary Care Physicians in the Rural Southeast. Health Services Research. 2006;41:79-102)
Thanks To: • The Kansas Department of Health and Environment for funding a portion of this study and for providing data. • The Kansas City University of Medicine and Biosciences for their generous support. • Sue Min Lai, PhD, KUMC • John Keighley, PhD, KUMC • Pradeep Chandra, MSIV, KCUMB