Download
1 / 21
210 likes | 387 Views
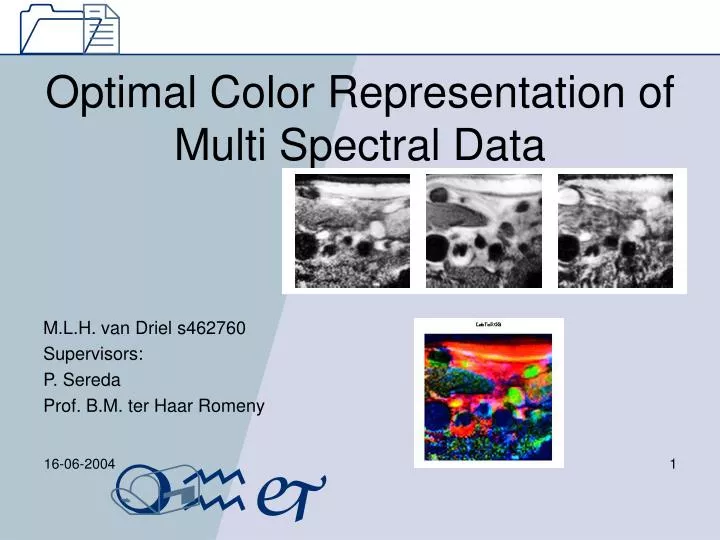
Optimal Color Representation of Multi Spectral Data. M.L.H. van Driel s462760 Supervisors: P. Sereda Prof. B.M. ter Haar Romeny. Contents . Introduction Artherosclerotic plaques Color Models RGB HSV CIE Lab Methods & Results Conclusions Discussion Recommendations. Introduction.

E N D
Optimal Color Representation of Multi Spectral Data M.L.H. van Driel s462760 Supervisors: P. Sereda Prof. B.M. ter Haar Romeny
Contents • Introduction • Artherosclerotic plaques • Color Models • RGB • HSV • CIE Lab • Methods & Results • Conclusions • Discussion • Recommendations
Introduction • From gray scale to multi spectral color images should improve the possibilities for tissue recognition and classification. • Examples are multi spectral MRI measurements for artherosclerotic plaque classifications in medium and large arteries.
Artherosclerotic plaques • Stable – Vulnerable • Important tissues • Calcification • Fibrous tissue • Hemorrhage • Lipid • Lumen S.v.d.Ven (2004)
Color Models • RGB (Red Green Blue) • HSV (Hue Saturation Value) • CIE Lab (Commission Internationale d`Eclaraige Lab)
Color Models - RGB • Primary colors • Range 0-255 (0-1) • Device dependant http://www.bodoni.co.uk/colourworkshop.html
Color Models - HSV • Hue: color • Saturation: dominance of hue • Value: lightness – darkness • Range (0-1) http://www.ncsu.edu/scivis/lessons/colormodels/color_models2.html
Color Models – CIE Lab • L – Lightness (0-100) • a – green red (-/+100) • b – blue yellow (-/+100) • Device independent • Difference between 2 colors in the Lab space is an indication of the contrast http://www.colourware.co.uk/cpfaq/q3-21.htm
Methods & Results • Input • Matching • Histogram Equalization • The Optimal Color Model and Configuration
Methods & Results - Input • 8 sets of 5 images with 3 tissues classified • T1 weighted (2D) TSE (1) • PD weighted TSE (2) • T1 weighted (3D) TFE (3) • Partial T2 weighted TSE (4) • T2 weighted TSE (5)
Methods & Results - input • Matching • Same regions in different images should have the same locations • Histogram Equalizing
Methods & Results – The Optimal Color Model and Configuration • Comparing the different Color Models • Converting RGB and HSV to CIE Lab * • Calculating the distances between the tissues *http://www.cs.rit.edu/~ncs/color/t_convert.html
Methods & Results – The Optimal Color Model and Configuration • Red = CIE Lab • Green = RGB • Blue = HSV
Methods & Results – The Optimal Color Model and Configuration • Maximum of the minimal distance • Cut off 30
Methods & Results – The Optimal Color Model and Configuration Good configurations? the configurations {{3,1,2},{3,2,1},{5,2,1},{5,1,2}} were found within the boundary conditions in 7 out of 8 cases (all within the Lab Color Model)
Conclusions • To distinguish just arbitrary tissues CIE Lab is an appropriate Color Model • In specific cases there can be better settings (in CIE Lab or even HSV) than in the arbitrary case • RGB should not be considered an option
Discussion • No Golden Truth • “Cut off 30” at least questionable • Histogram Equalization? • Other input
Discussion • Histogram Equalization • Filters
Recommendations • 5D instead of 3D input • Differentiate for distinguishing different tissues • Alternative for Histogram Equalization • Other inputs
Thanks • Petr Sereda • Bart ter Haar Romeny • Woutjan Branderhorst • Martin Knýř